

Question: Please review my Excel data and scatter plot for Control's Delta and Alpha coupling ranked according to Spearman's to make sure they ranking and scatter
Please review my Excel data and scatter plot for Control's Delta and Alpha coupling ranked according to Spearman's to make sure they ranking and scatter plot was created correctly and that the formatting is correct.
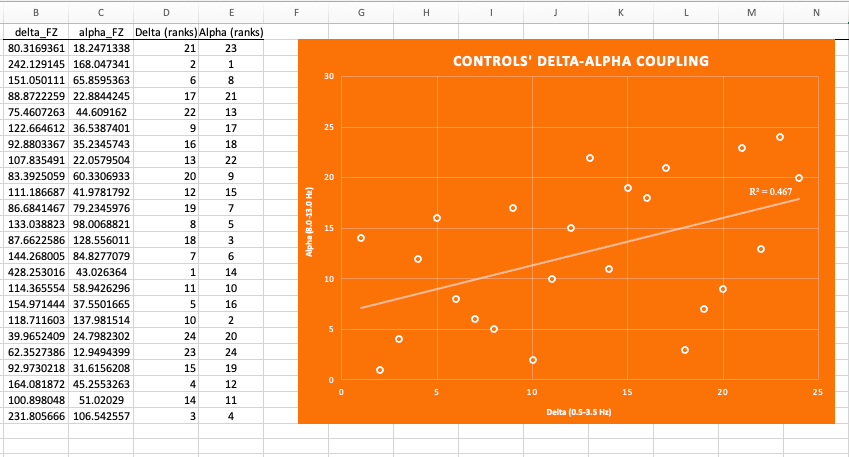
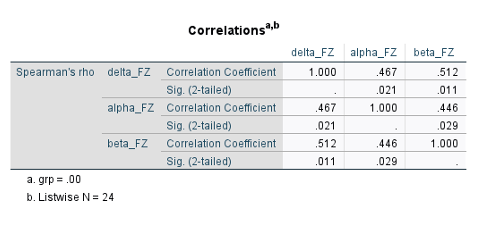
B C D E F G H K M N delta_FZ alpha_FZ Delta (ranks) Alpha (ranks) 80.3169361 18.2471338 21 23 242.129145 168.047341 2 1 CONTROLS' DELTA-ALPHA COUPLING 151.050111 65.8595363 6 8 30 88.8722259 22.8844245 17 21 75.4607263 44.609162 22 13 122.664612 36.5387401 9 17 25 O 92.8803367 35.2345743 16 18 O 107.835491 22.0579504 13 22 O 83.3925059 60.3306933 20 9 20 O 111.186687 41.9781792 12 15 O R2 = 0.467 86.6841467 79.2345976 19 7 O 133.038823 98.0068821 O 8 5 Alpha (8.0-13.0 Hz] 15 87.6622586 128.556011 18 3 O 144.268005 84.8277079 7 6 O 428.253016 43.026364 14 O 10 O 114.365554 58.9426296 11 10 154.971444 37.5501665 5 16 O 118.711603 137.981514 10 2 O 5 39.9652409 24.7982302 24 20 O 62.3527386 12.9494399 23 24 O 92.9730218 31.6156208 15 19 O 164.081872 45.2553263 4 12 5 10 15 20 25 100.898048 51.02029 14 11 231.805666 106.542557 3 4 Delta (0.5-3.5 Hz)Correlationsa,b delta_FZ alpha_FZ beta_FZ Spearman's rho delta_FZ Correlation Coefficient 1.000 467 .512 Sig. (2-tailed) .021 011 alpha_FZ Correlation Coefficient 467 1.000 446 Sig. (2-tailed) 021 029 beta_FZ Correlation Coefficient 512 446 1,000 Sig. (2-tailed) 011 029 a. grp = .00 b. Listwise N = 24
Step by Step Solution
There are 3 Steps involved in it

Get step-by-step solutions from verified subject matter experts