

Question: Please review the follow chart and select all that apply. Percent with Diabetes Setting Self-Management Goals P chart 100 90 - 80 - 70- 60
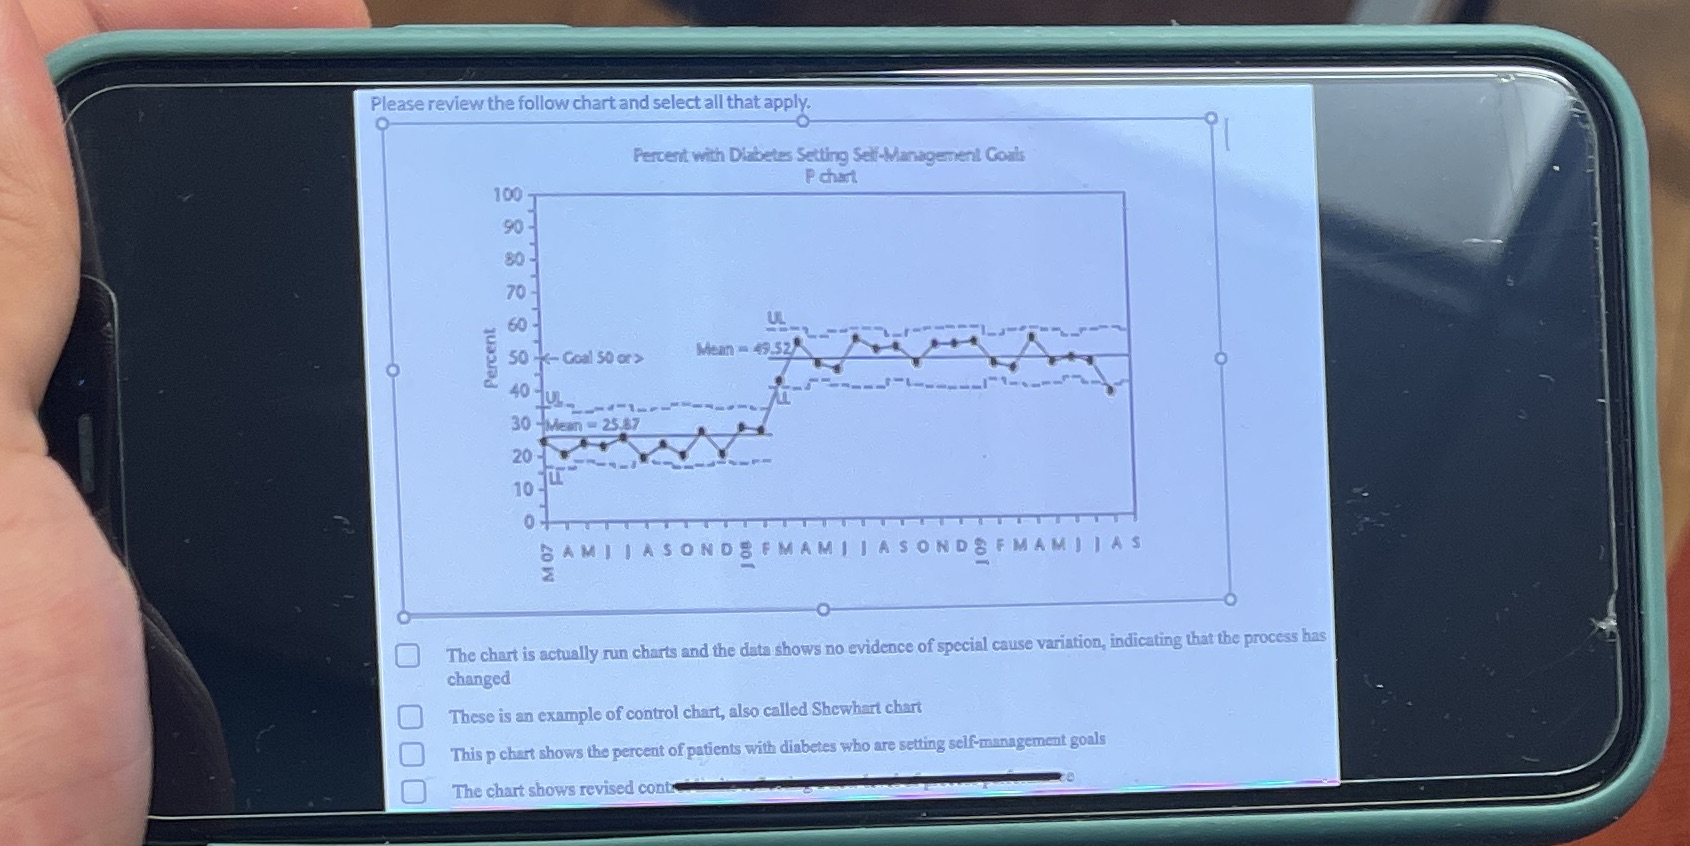
Please review the follow chart and select all that apply. Percent with Diabetes Setting Self-Management Goals P chart 100 90 - 80 - 70- 60 Percent 50 -- Goal 50 or > Mean - 49.52 40 UL 30 Mean - 25.87 20 - 10 SAMIJASONDFMAMI JASONDFMAMI JAS The chart is actually run charts and the data shows no evidence of special cause variation, indicating that the process has changed U These is an example of control chart, also called Shewhart chart This p chart shows the percent of patients with diabetes who are setting self-management goals The chart shows revised cont
Step by Step Solution
There are 3 Steps involved in it
1 Expert Approved Answer
Step: 1 Unlock

Question Has Been Solved by an Expert!
Get step-by-step solutions from verified subject matter experts
Step: 2 Unlock
Step: 3 Unlock