

Question: please see attached file for detailed. Please show step by step. Thanks, For the following, create a scatterplot and describe what you learn from it.
please see attached file for detailed. Please show step by step. Thanks,
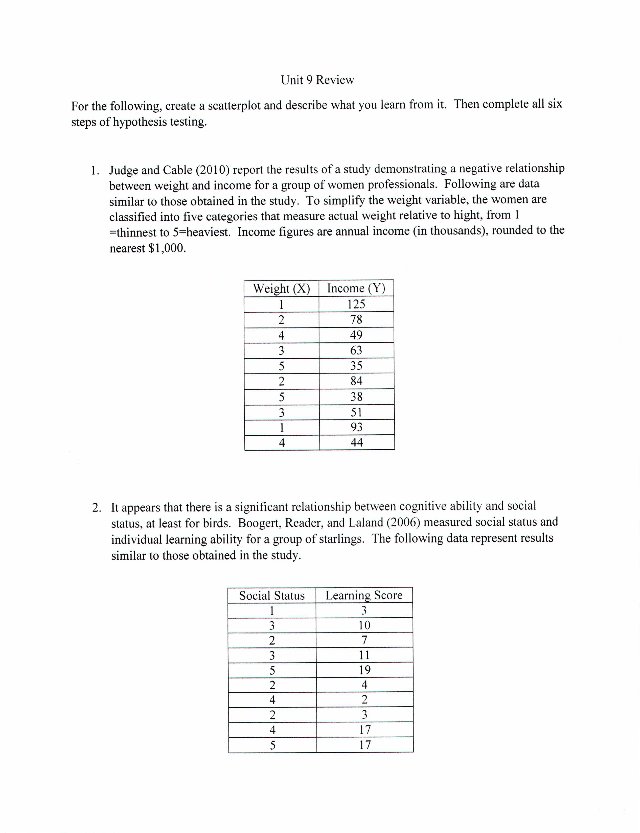
For the following, create a scatterplot and describe what you learn from it. Then complete all six steps of hypothesis testing.
1. Judge and Cable (2010) report the results of a study demonstrating a negati ve relationship between weight and income for a group of women professionals. Following are data similar to those obtained in the study. To simplify the weight variable, the women are classified into five categories that measure actual weight relative to hight, from 1
to . Income figures are annual income (in thousands), rounded to the nearest $1,000.
| Weight (X) | Income (Y) |
| 1 | 125 |
| 2 | 78 |
| 4 | 49 |
| 3 | 63 |
| 5 | 35 |
| 2 | 84 |
| 5 | 38 |
| 3 | 51 |
| 1 | 93 |
| 4 | 44 |
2. It appears that there is a significant relationship between cognitive ability and social status, at least for birds. Boogert , Reader, and Laland (2006) measured social status and individual learning ability for a group of starlings. The following data represent results similar to those obtained in the study.
| Social Status | Learning Score |
| 1 | 3 |
| 3 | 10 |
| 2 | 7 |
| 3 | 11 |
| 5 | 19 |
| 2 | 4 |
| 4 | 2 |
| 2 | .., -' |
| 4 | 17 |
| 5 | 17 |
3. Identifing individuals with a high risk of Alzheimer's disease usually involves a long series of cognitive tests. However, researchers have developed a 7-Minute Screen, which is a quick and easy way to accomplish the same goal. The question is whether the 7- Minute Screen is as effective as the complete series of tests. To address this question, ljuin et al. (2008) administered both tests to a group of patients and compared the results. The following data represent results similar to those obtained in the study.
| 7-Minute Screen | Cognitive |
| Series | |
| 3 | 11 |
| 8 | 19 |
| 10 | 22 |
| 8 | 20 |
| 4 | 14 |
| 7 | 13 |
| 4 | 9 |
| 5 | 20 |
| 14 | 25 |
Unit 9 Review For the following, create a scatterplot and describe what you learn from it. Then complete all six steps of hypothesis testing. 1. Judge and Cable (2010) report the results of a study demonstrating a negative relationship between weight and income for a group of women professionals. Following are data similar to those obtained in the study. To simplify the weight variable, the women are classified into five categories that measure actual weight relative to hight, from 1 =thinnest to 5=heaviest. Income figures are annual income (in thousands), rounded to the nearest $1,000. Weight (X) 1 2 4 3 5 2 5 3 1 4 Income (Y) 125 78 49 63 35 84 38 51 93 44 2. It appears that there is a significant relationship between cognitive ability and social status, at least for birds. Boogert, Reader, and Laland (2006) measured social status and individual learning ability for a group of starlings. The following data represent results similar to those obtained in the study. Social Status 1 3 2 3 5 2 4 2 4 5 Learning Score 3 10 7 11 19 4 2 3 17 17 3. Identifing individuals with a high risk of Alzheimer's disease usually involves a long series of cognitive tests. However, researchers have developed a 7-Minute Screen, which is a quick and easy way to accomplish the same goal. The question is whether the 7Minute Screen is as effective as the complete series of tests. To address this question, Ijuin et al. (2008) administered both tests to a group of patients and compared the results. The following data represent results similar to those obtained in the study. 7-Minute Screen 3 8 10 8 4 7 4 5 14 Cognitive Series 11 19 22 20 14 13 9 20 25
Step by Step Solution
There are 3 Steps involved in it

Get step-by-step solutions from verified subject matter experts