

Question: please see attached question. Question 16 Score on last try: 0.25 of 1 pts. See Details for more. > Next question You can retry this
please see attached question.
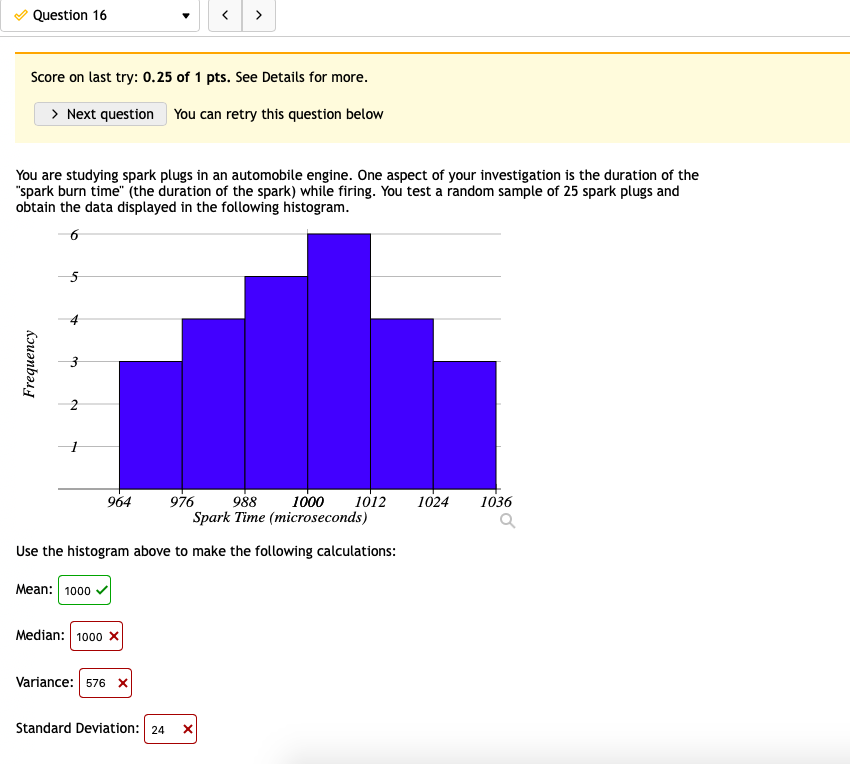
Question 16 Score on last try: 0.25 of 1 pts. See Details for more. > Next question You can retry this question below You are studying spark plugs in an automobile engine. One aspect of your investigation is the duration of the spark burn time" (the duration of the spark) while firing. You test a random sample of 25 spark plugs and obtain the data displayed in the following histogram. Frequency 2 964 976 988 1000 1012 1024 1036 Spark Time (microseconds) Q Use the histogram above to make the following calculations: Mean: 1000 Median: 1000 X Variance: X Standard Deviation: |24 X
Step by Step Solution
There are 3 Steps involved in it
1 Expert Approved Answer
Step: 1 Unlock

Question Has Been Solved by an Expert!
Get step-by-step solutions from verified subject matter experts
Step: 2 Unlock
Step: 3 Unlock