

Question: Please see below assignment and use the financial ratio sheet given by the lecturer. Need this in the next 2 hrs : Net Profit Margin
Please see below assignment and use the financial ratio sheet given by the lecturer. Need this in the next 2 hrs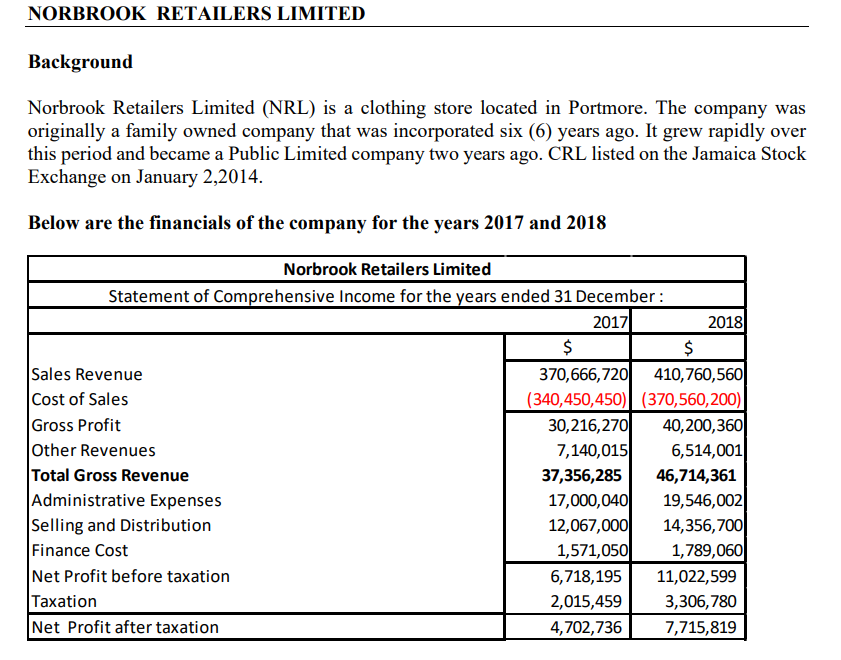
 :
: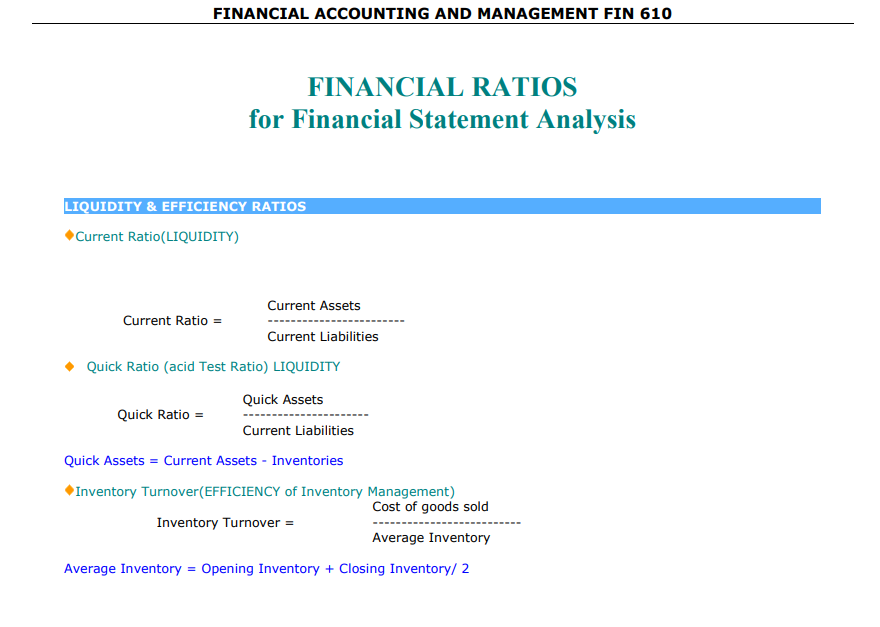
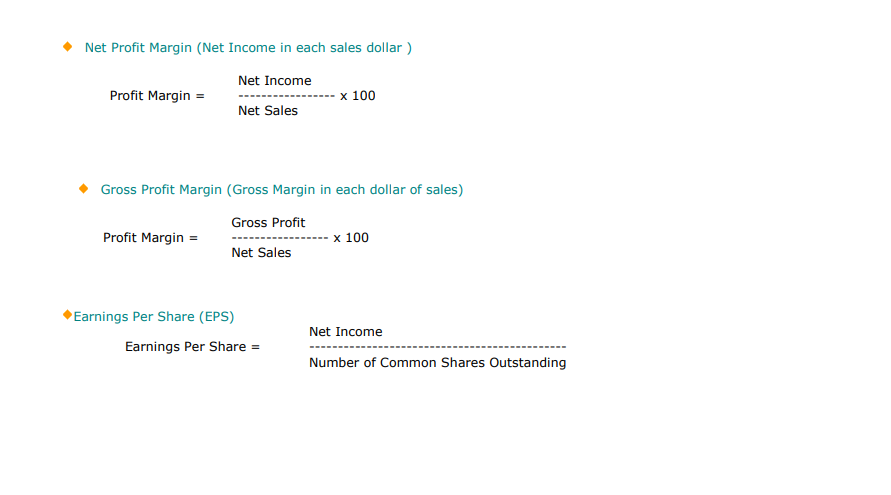
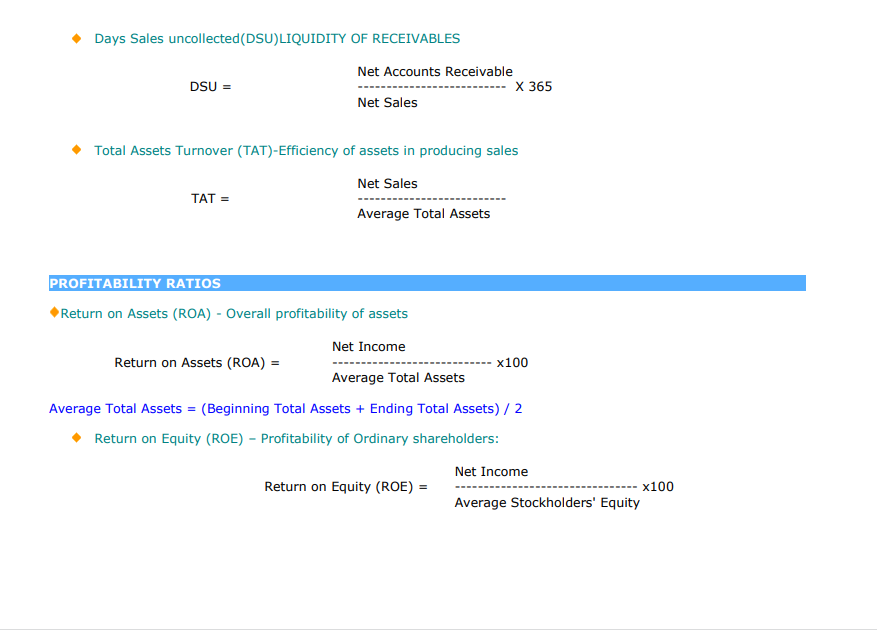
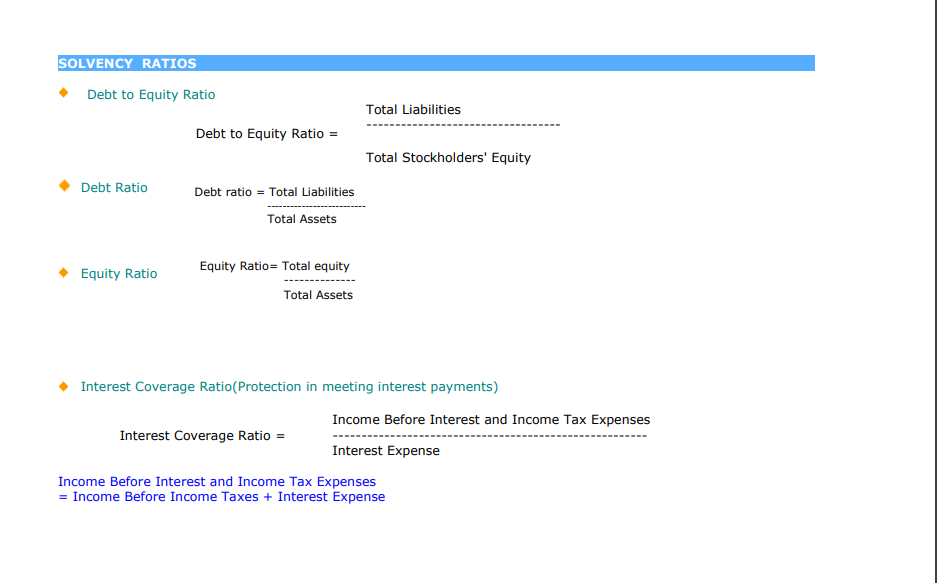
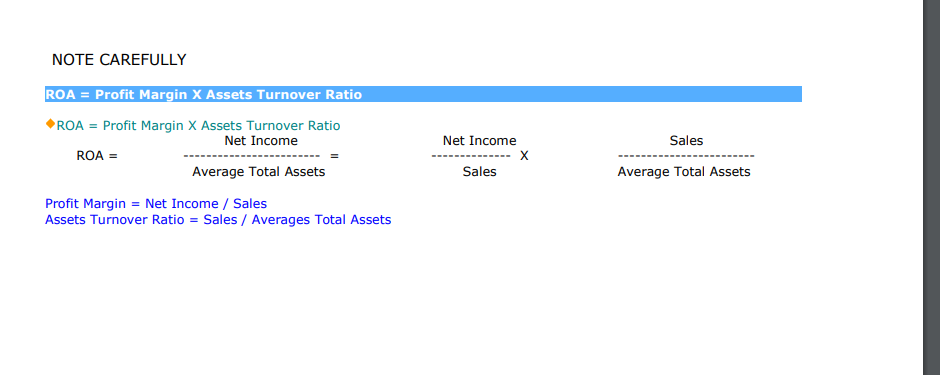
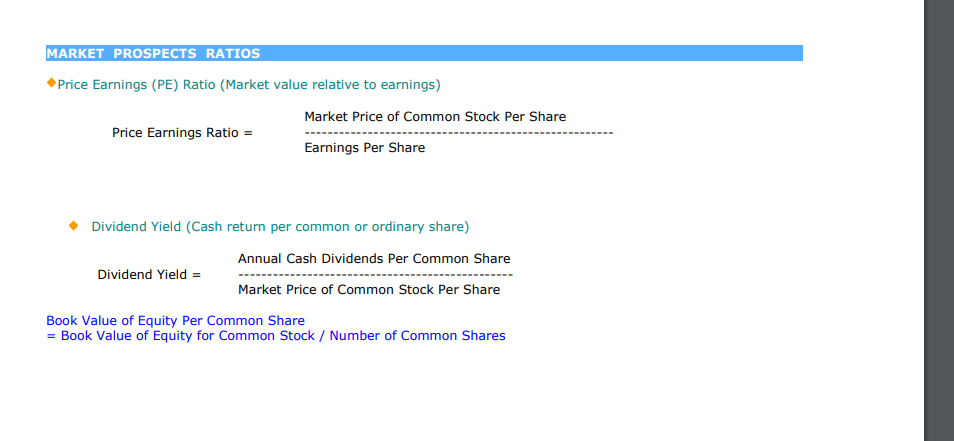
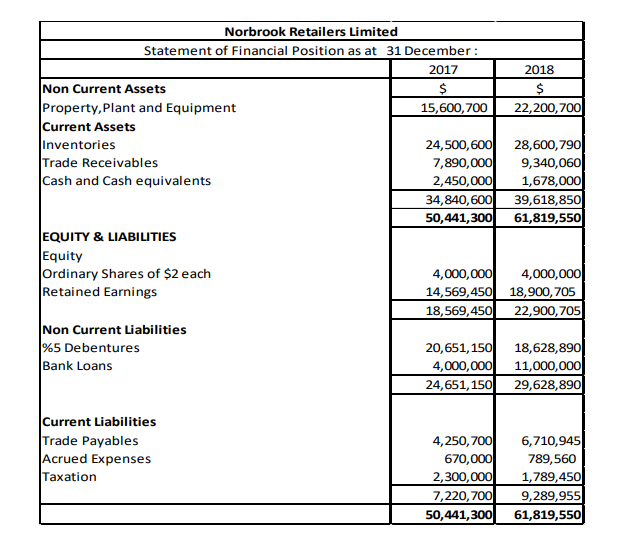
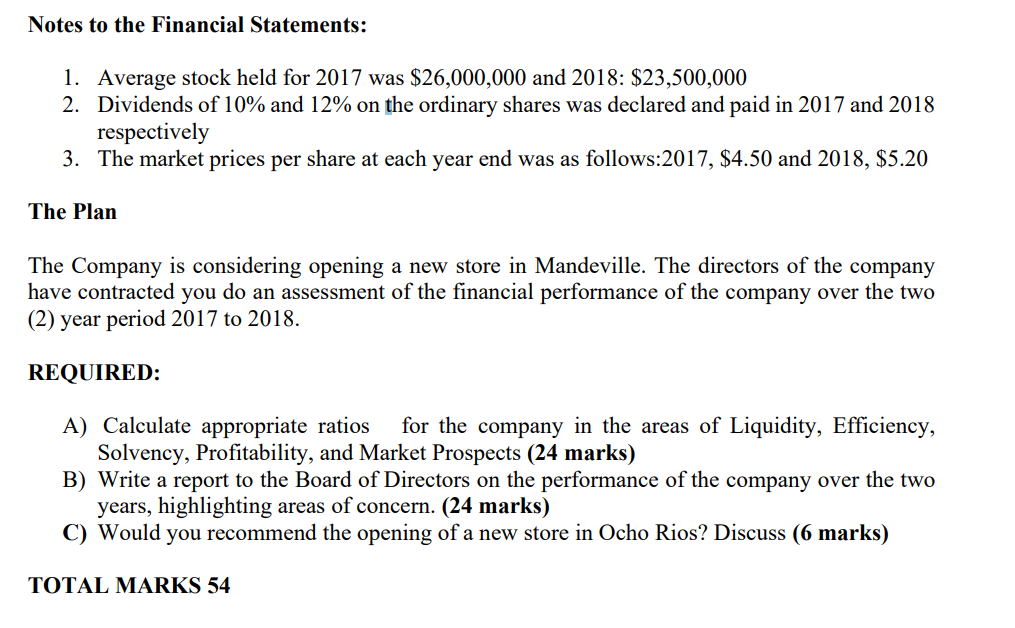
Net Profit Margin (Net Income in each sales dollar) Gross Profit Margin (Gross Margin in each dollar of sales) Earnings Per Share (EPS) \\begin{tabular}{ll} Earnings Per Share \\( = \\) & Net Income \\\\ \\hline Number of Common Shares Outstanding \\end{tabular} Notes to the Financial Statements: 1. Average stock held for 2017 was \\( \\$ 26,000,000 \\) and 2018 : \\( \\$ 23,500,000 \\) 2. Dividends of \10 and \12 on the ordinary shares was declared and paid in 2017 and 2018 respectively 3. The market prices per share at each year end was as follows:2017, \\( \\$ 4.50 \\) and \\( 2018, \\$ 5.20 \\) The Plan The Company is considering opening a new store in Mandeville. The directors of the company have contracted you do an assessment of the financial performance of the company over the two (2) year period 2017 to 2018 . REQUIRED: A) Calculate appropriate ratios for the company in the areas of Liquidity, Efficiency, Solvency, Profitability, and Market Prospects (24 marks) B) Write a report to the Board of Directors on the performance of the company over the two years, highlighting areas of concern. (24 marks) C) Would you recommend the opening of a new store in Ocho Rios? Discuss (6 marks) TOTAL MARKS 54 FINANCIAL RATIOS for Financial Statement Analysis DITY \\& EFFICIENCY RATIOS ent Ratio(LIQUIDITY) \\[ \\begin{array}{ll} \\text { Current Ratio }=\\quad & \\text { Current Assets } \\\\ & \\text { Current Liabilities } \\end{array} \\] ick Ratio (acid Test Ratio) LIQUIDITY \\[ \\begin{array}{ll} & \\text { Quick Assets } \\\\ \\text { Quick Ratio = } \\quad \\text { Current Liabilities } \\end{array} \\] Background Norbrook Retailers Limited (NRL) is a clothing store located in Portmore. The company was originally a family owned company that was incorporated six (6) years ago. It grew rapidly over this period and became a Public Limited company two years ago. CRL listed on the Jamaica Stock Exchange on January 2,2014. Below are the financials of the company for the years 2017 and 2018 Price Earnings (PE) Ratio (Market value relative to earnings) Price Earnings Ratio \\( = \\) Market Price of Common Stock Per Share Earnings Per Share - Dividend Yield (Cash return per common or ordinary share) Annual Cash Dividends Per Common Share Dividend Yield \\( = \\) Market Price of Common Stock Per Share Book Value of Equity Per Common Share = Book Value of Equity for Common Stock / Number of Common Shares Days Sales uncollected(DSU)LIQUIDITY OF RECEIVABLES \\[ \\begin{array}{ll} & \\text { Net Accounts Receivable } \\\\ \\text { DSU }= & \\text { Net Sales } \\end{array} \\] Total Assets Turnover (TAT)-Efficiency of assets in producing sales \\[ \\begin{array}{ll} & \\text { Net Sales } \\\\ \\hline- \\text { TAT }= & \\text { Average Total Assets } \\end{array} \\] Net Sales Average Total Assets OFITABILITY RATIOS Return on Assets (ROA) - Overall profitability of assets Net Income Average Total Assets erage Total Assets \\( =( \\) Beginning Total Assets + Ending Total Assets \\( ) / 2 \\) Return on Equity (ROE) - Profitability of Ordinary shareholders: Interest Coverage Ratio(Protection in meeting interest payments) \\[ \\text { Interest Coverage Ratio }= \\] Income Before Interest and Income Tax Expenses Interest Expense Income Before Interest and Income Tax Expenses = Income Before Income Taxes + Interest Expense NOTE CAREFULLY ROA = Profit Margin X Assets Turnover Ratio ROA = Profit Margin X Assets Turnover Ratio Net Income \\[ \\mathrm{ROA}= \\] Sales Average Total Assets Profit Margin \\( = \\) Net Income \\( / \\) Sales Assets Turnover Ratio \\( = \\) Sales \\( / \\) Averages Total Assets
Step by Step Solution
There are 3 Steps involved in it

Get step-by-step solutions from verified subject matter experts