

Question: Please see below. I need help with this. Please include a thorough explanation of what was done and the answer. 2. The following stemplot gives
Please see below. I need help with this. Please include a thorough explanation of what was done and the answer.
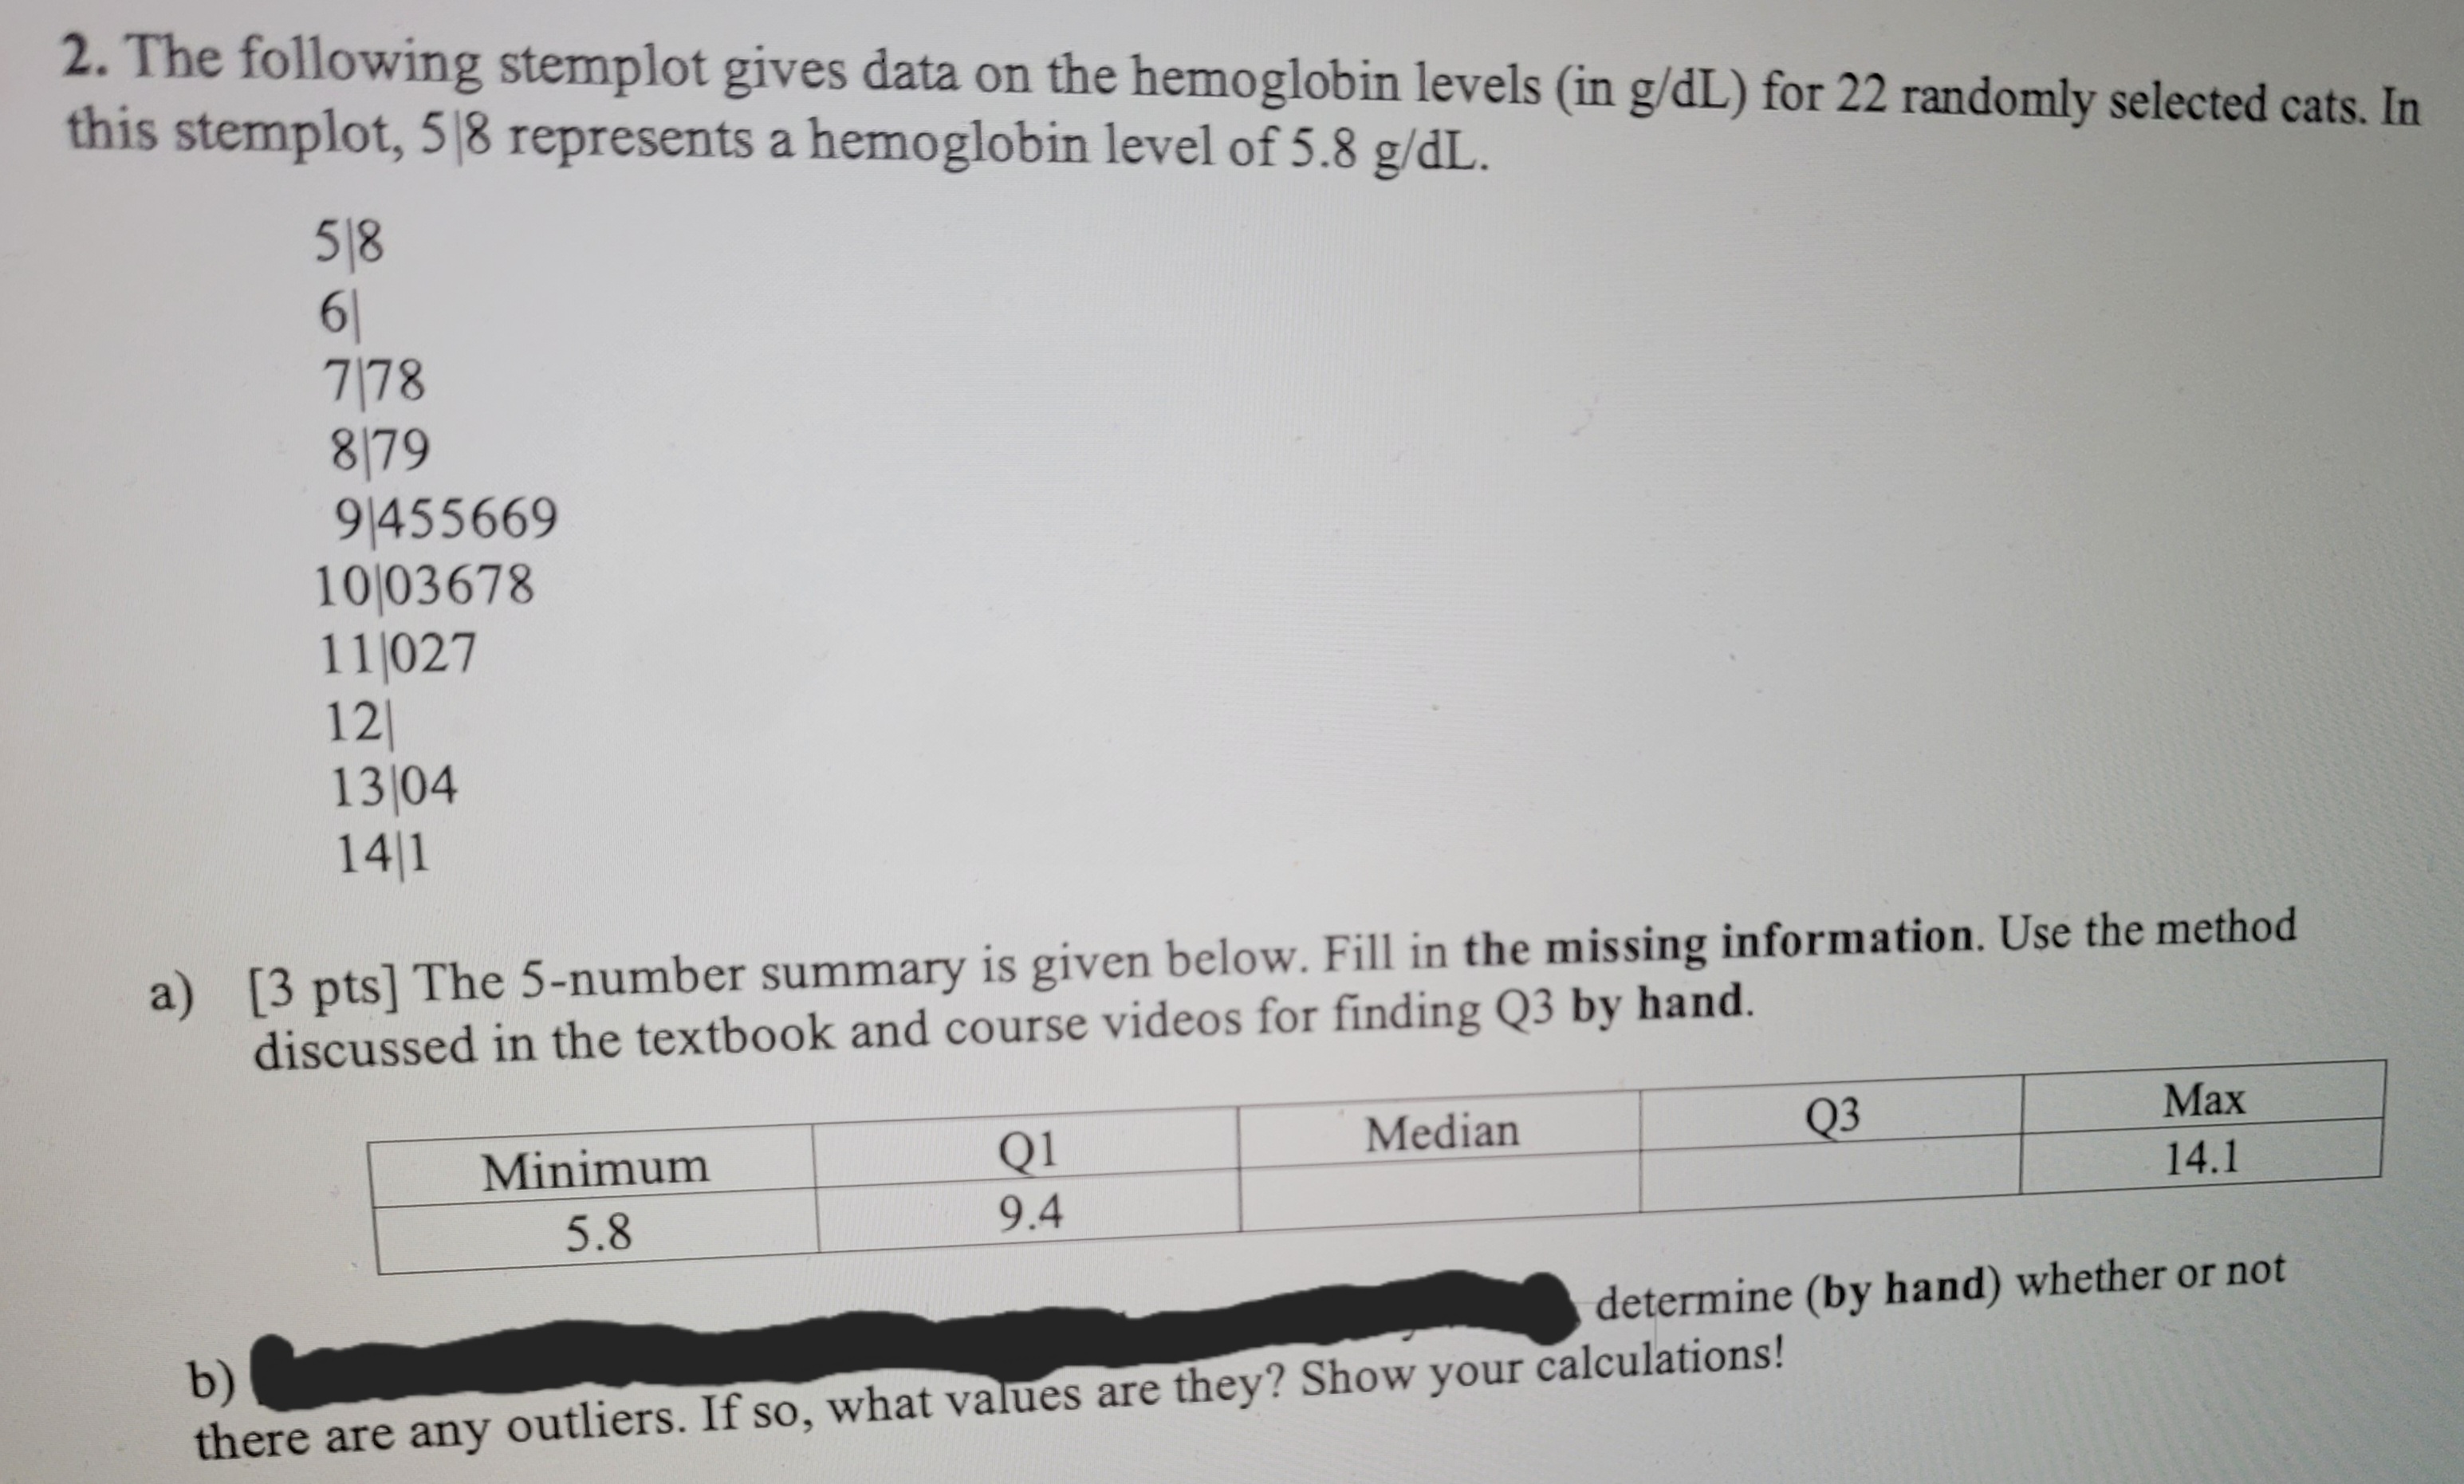
2. The following stemplot gives data on the hemoglobin levels (in g/dL) for 22 randomly selected cats. In this stemplot, 518 represents a hemoglobin level of 5.8 g/dL. 518 6 7 78 8 79 9 455669 10 03678 11 027 12 13 04 14 1 a) [3 pts] The 5-number summary is given below. Fill in the missing information. Use the method discussed in the textbook and course videos for finding Q3 by hand. Minimum Q1 Median Q3 Max 5.8 9.4 14.1 determine (by hand) whether or not b ) there are any outliers. If so, what values are they? Show your calculations
Step by Step Solution
There are 3 Steps involved in it

Get step-by-step solutions from verified subject matter experts