

Question: Please see both pics and answer questions. The data below are the ages and systolic blood pressures (measured in millimeters of mercury) of 9 randomly
Please see both pics and answer questions.
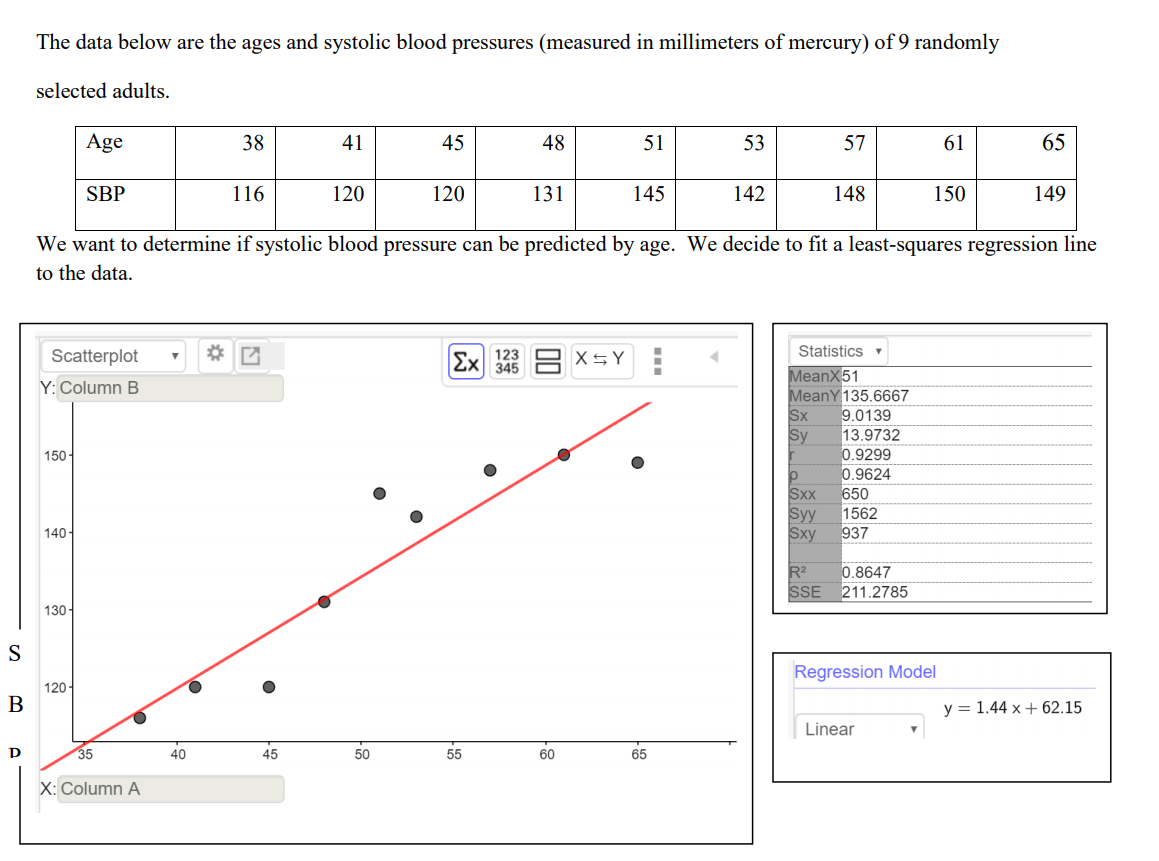
The data below are the ages and systolic blood pressures (measured in millimeters of mercury) of 9 randomly selected adults. Age 38 41 45 48 51 53 57 61 65 SBP 116 120 120 131 145 142 148 150 149 We want to determine if systolic blood pressure can be predicted by age. We decide to t a least-squares regression line to the data. Scatterplot i? E Statistics v Y: Column B Regression Model y = 1.44 x + 62.15 Linear X: Column A \f
Step by Step Solution
There are 3 Steps involved in it
1 Expert Approved Answer
Step: 1 Unlock

Question Has Been Solved by an Expert!
Get step-by-step solutions from verified subject matter experts
Step: 2 Unlock
Step: 3 Unlock