

Question: Please see picture. T-Test One-Sample Statistics Std, Error N Mean Std. Deviation Mean Value for Money 235 3.31 1.014 066 Products I Need 236 3.79
Please see picture.
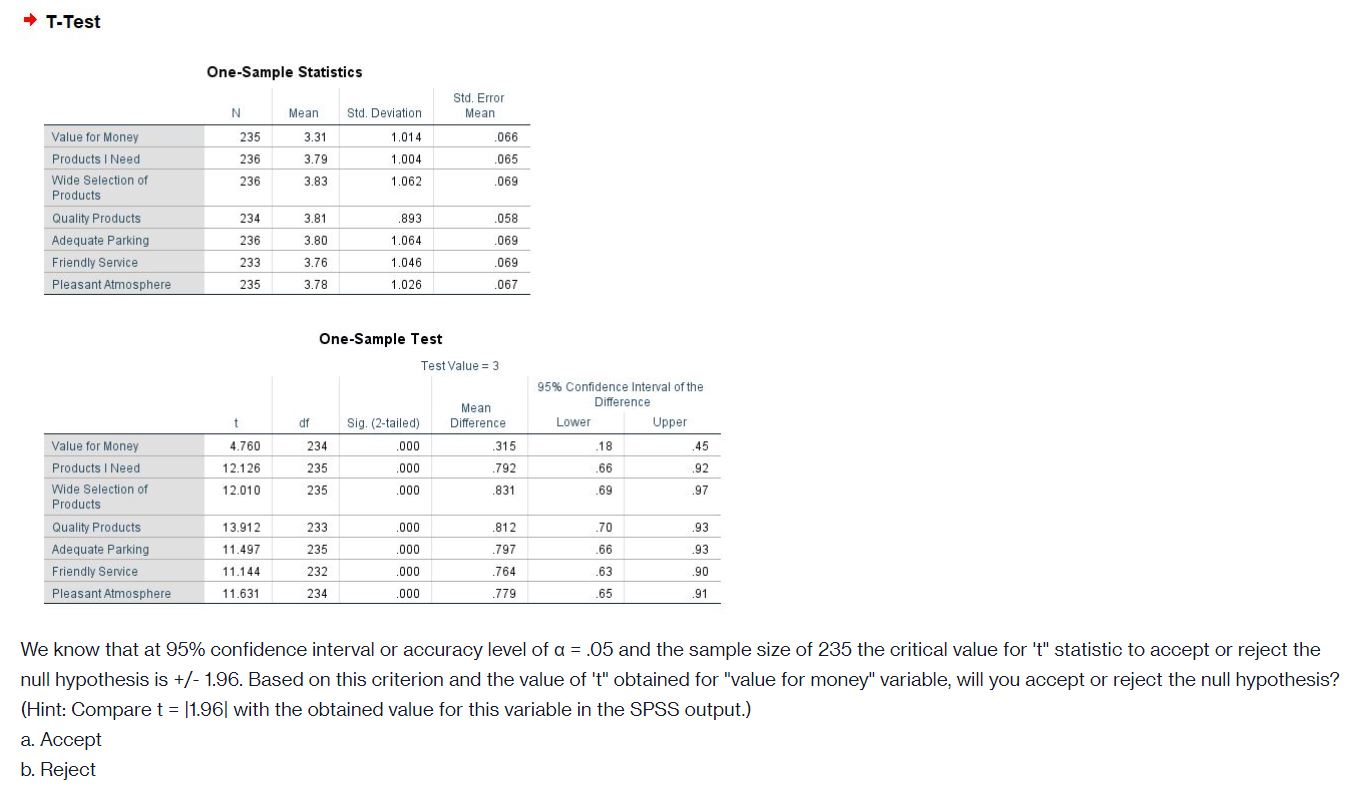
T-Test One-Sample Statistics Std, Error N Mean Std. Deviation Mean Value for Money 235 3.31 1.014 066 Products I Need 236 3.79 1.004 065 Wide Selection of 236 3.83 1.062 .069 Products Quality Products 234 3.81 .893 058 Adequate Parking 236 3.80 1.064 069 Friendly Service 233 3.76 1.046 069 Pleasant Atmosphere 235 3.78 1.026 067 One-Sample Test Test Value = 3 95% Confidence Interval of the Mean Difference df Sig. (2-tailed) Difference Lower Upper Value for Money 4.760 234 000 .315 18 45 Products I Need 12.126 235 000 .792 66 .92 Wide Selection of 12.010 235 000 831 69 .97 Products Quality Products 13.912 233 000 812 70 .93 Adequate Parking 11.497 235 000 .797 99 .93 Friendly Service 11.144 232 000 764 63 .90 Pleasant Atmosphere 11.631 234 000 779 65 .91 We know that at 95% confidence interval or accuracy level of a = .05 and the sample size of 235 the critical value for 't" statistic to accept or reject the null hypothesis is +/- 1.96. Based on this criterion and the value of 't" obtained for "value for money" variable, will you accept or reject the null hypothesis? (Hint: Compare t = [1.96| with the obtained value for this variable in the SPSS output.) a. Accept b. Reject
Step by Step Solution
There are 3 Steps involved in it

Get step-by-step solutions from verified subject matter experts