

Question: PLEASE SEE QUESTION ATTACHED . PLEASE SUBMIT ANSWERS IN A DOCUMENT FORM .. THANK YOU Question 1. A random sample of 50 outputs of Product
PLEASE SEE QUESTION ATTACHED . PLEASE SUBMIT ANSWERS IN A DOCUMENT FORM .. THANK YOU
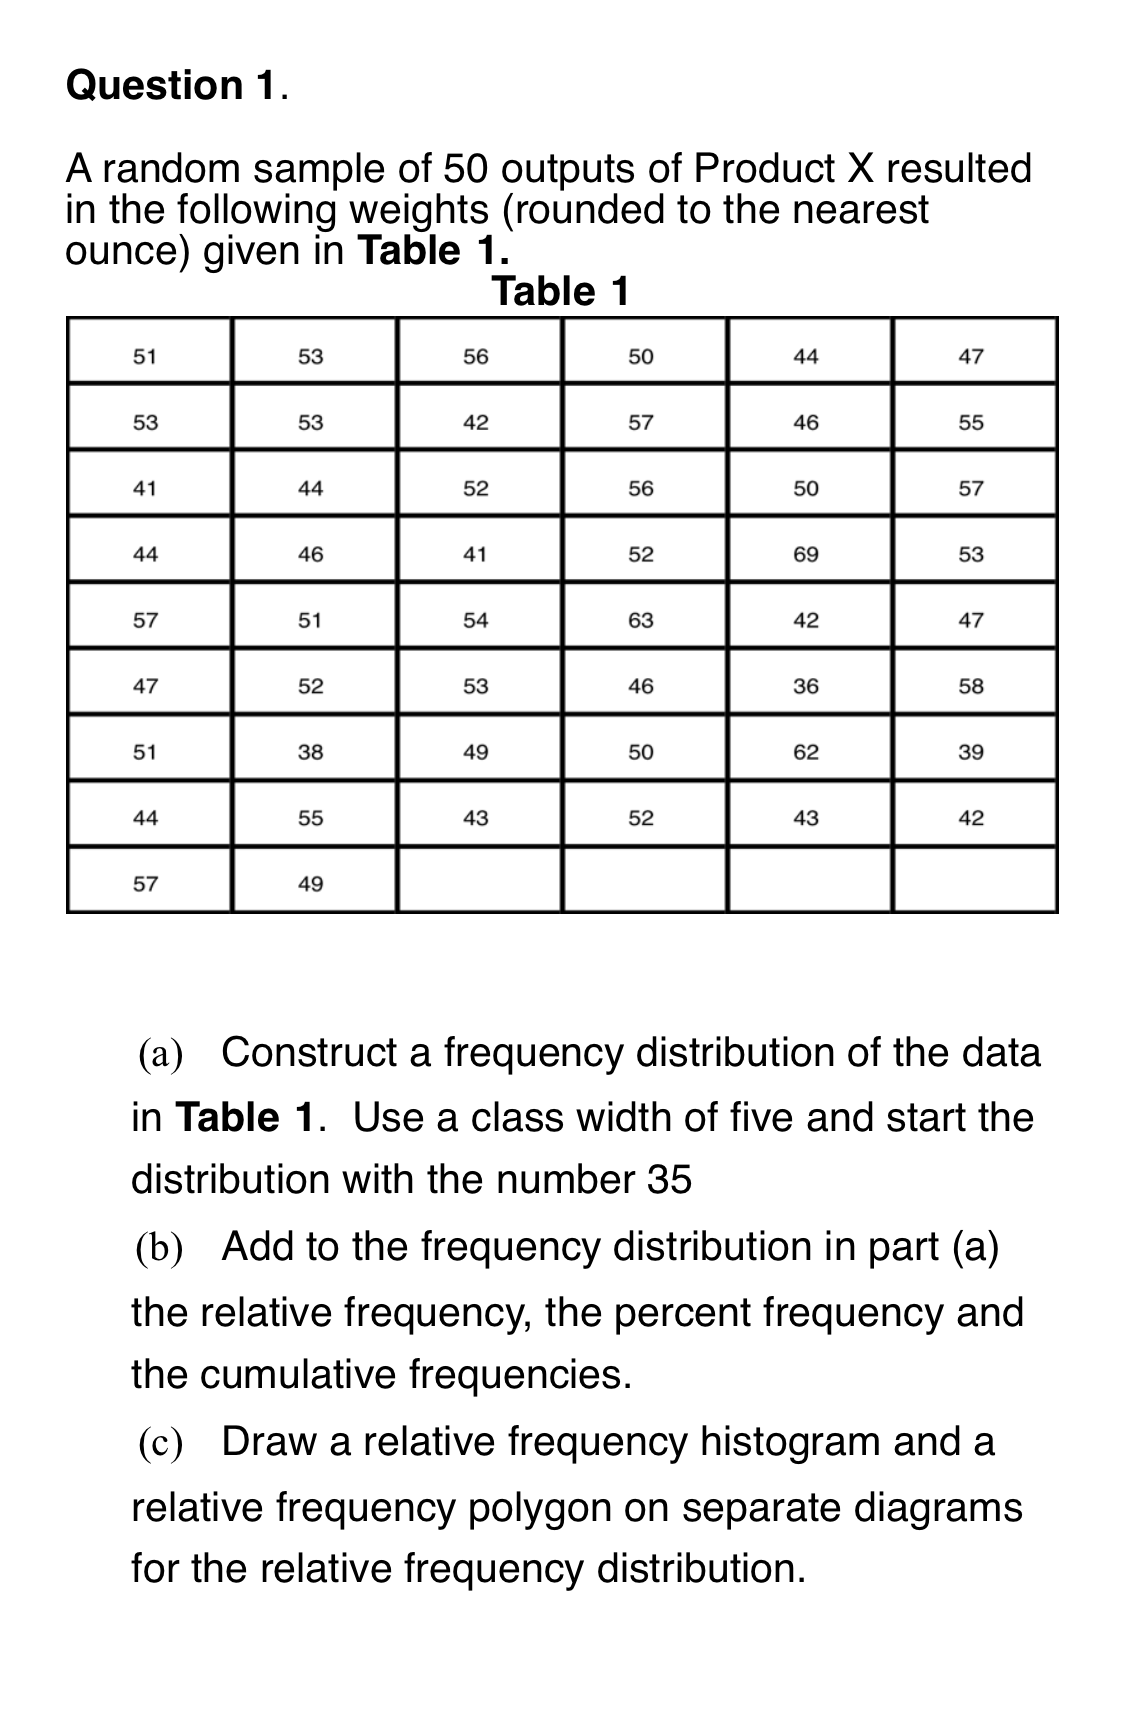
Question 1. A random sample of 50 outputs of Product X resulted in the following weights (rounded to the nearest ounce) given in Table 1. Table 1 3 'cl 2 U1 .4 .4. \\l (D nun un- nun "n u B\" n"- -_ -- & '4 'sl (a) Construct a frequency distribution of the data in Table 1. Use a class width of five and start the distribution with the number 35 (b) Add to the frequency distribution in part (a) the relative frequency, the percent frequency and the cumulative frequencies. (c) Draw a relative frequency histogram and a relative frequency polygon on separate diagrams for the relative frequency distribution
Step by Step Solution
There are 3 Steps involved in it

Get step-by-step solutions from verified subject matter experts