

Question: Please see the attached image for the full question. Exhibit 1-5 The following is a frequency distribution of the monthly expenditures for long distance telephone
Please see the attached image for the full question.
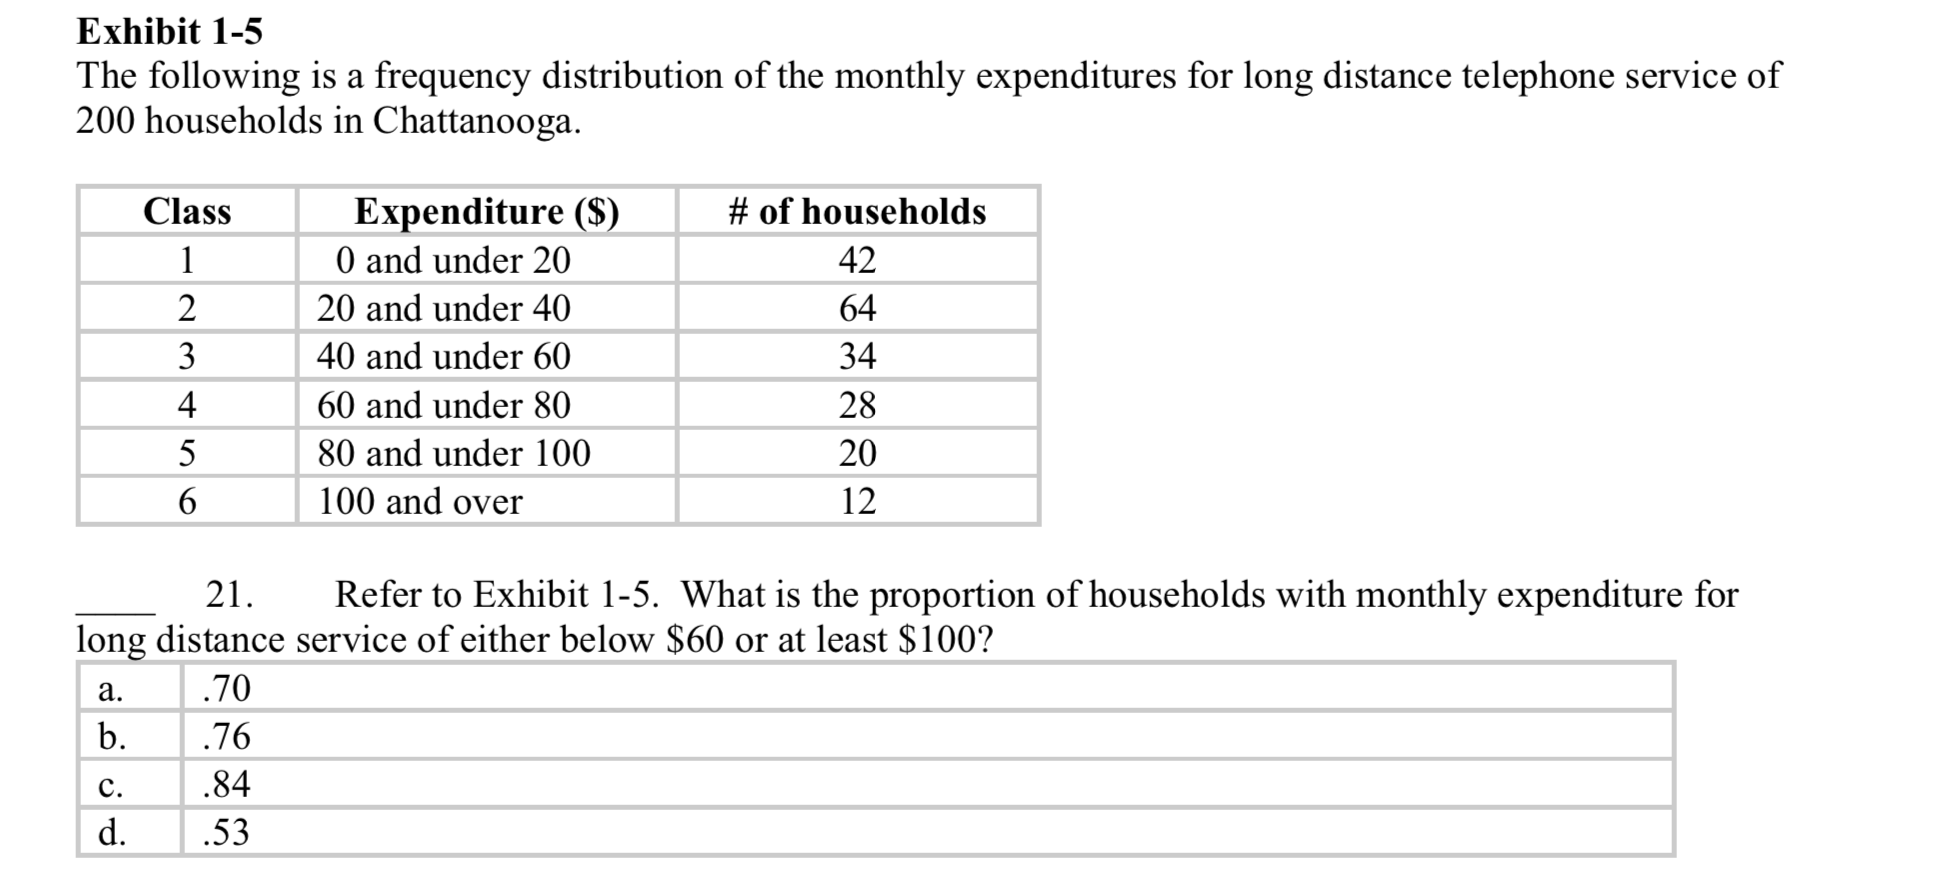
Exhibit 1-5 The following is a frequency distribution of the monthly expenditures for long distance telephone service of 200 households in Chattanooga. - _- 60 and under 80 80 and under 100 .- 100 and over 21. Refer to Exhibit 1-5. What is the proportion of households with monthly expenditure for lon - distance service of either below $60 or at least $100
Step by Step Solution
There are 3 Steps involved in it
1 Expert Approved Answer
Step: 1 Unlock

Question Has Been Solved by an Expert!
Get step-by-step solutions from verified subject matter experts
Step: 2 Unlock
Step: 3 Unlock