

Question: Please see the attached picture for the problem. I hope you can give the answer tonight. Thanks. Quiz #2 Due February 15, 2018, 6PM Work
Please see the attached picture for the problem. I hope you can give the answer tonight. Thanks.
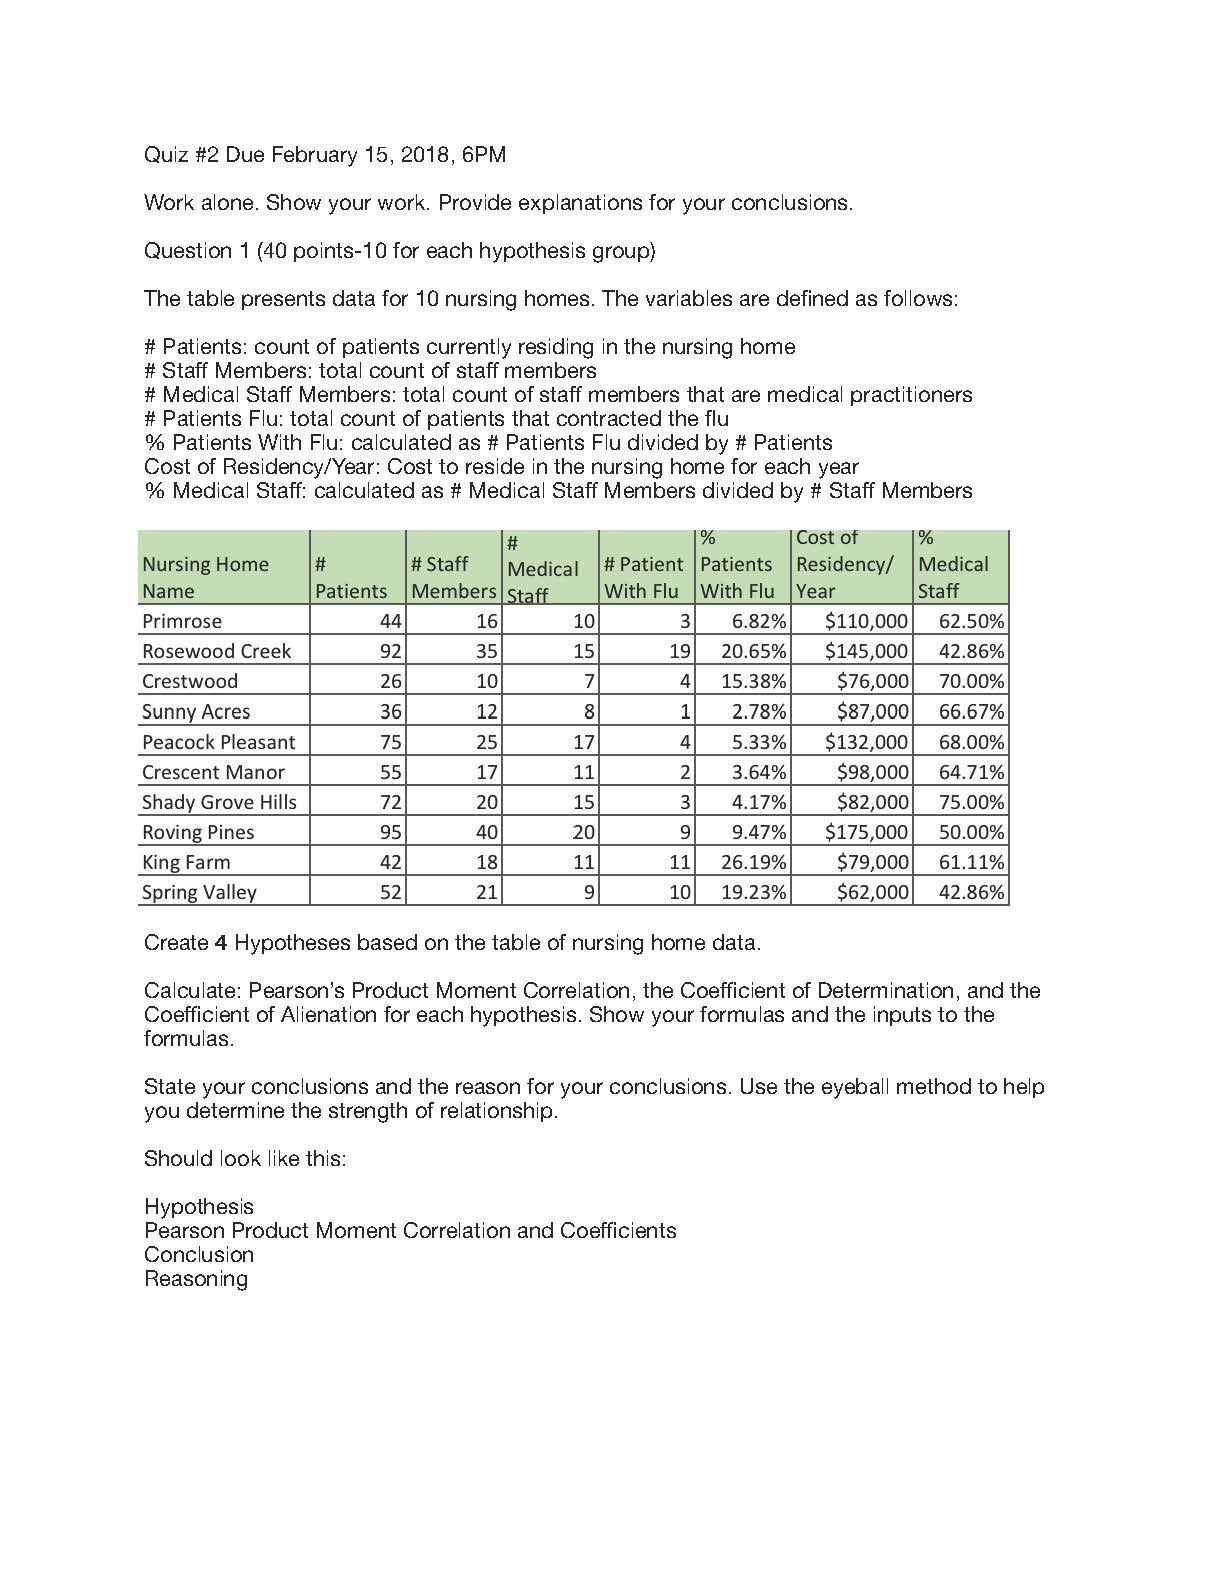
Quiz #2 Due February 15, 2018, 6PM Work alone. Show your work. Provide explanations for your conclusions. Question 1 (40 points-10 for each hypothesis group) The table presents data for 10 nursing homes. The variables are defined as follows: # Patients: count of patients currently residing in the nursing home # Staff Members: total count of staff members # Medical Staff Members: total count of staff members that are medical practitioners # Patients Flu: total count of patients that contracted the flu % Patients With Flu: calculated as # Patients Flu divided by # Patients Cost of Residency/Year: Cost to reside in the nursing home for each year % Medical Staff: calculated as # Medical Staff Members divided by # Staff Members _ _ ax _ .35. -._EOS'tiof' _ %2 ursi'nsHame-t "Kir- '3#-5'caf' Medical xiii-1'3\"\"! Patients; Ra-dam! Med-cal Name-z Patients} Mibrs -- - wanna. With-Flu. Year Staff 1 6.32% $110,000 62.50% 20.65% $145,000 42.36% 15.33% 576,000 70.00% I 2.73% 537,000 66.67% I 5.33% $132,000 63.00% - 2 3.64% $98,000 64.71% 4.17% $82,000 75.00% I I 9.47% $175,000 50.00% - 1 26.19% $79,000 61.11% 1 19.23% 562,00 42.36% Create 4 Hypotheses based on the table of nursing home data. Calculate: Pearson's Product Moment Correlation, the Coefficient of Determination, and the Coefficient of Alienation for each hypothesis. Show your formulas and the inputs to the formulas. State your conclusions and the reason for your conclusions. Use the eyeball method to help you determine the strength of relationship. Should look like this: Hypothesis Pearson Product Moment Correlation and Coefficients Conclusion Reasoning
Step by Step Solution
There are 3 Steps involved in it

Get step-by-step solutions from verified subject matter experts