

Question: Please see the attached21. Answer and explain your solution. Thanks. Below is a graphical illustration of a typical firm operating in a monopolistically competitive industry:
Please see the attached21. Answer and explain your solution. Thanks.
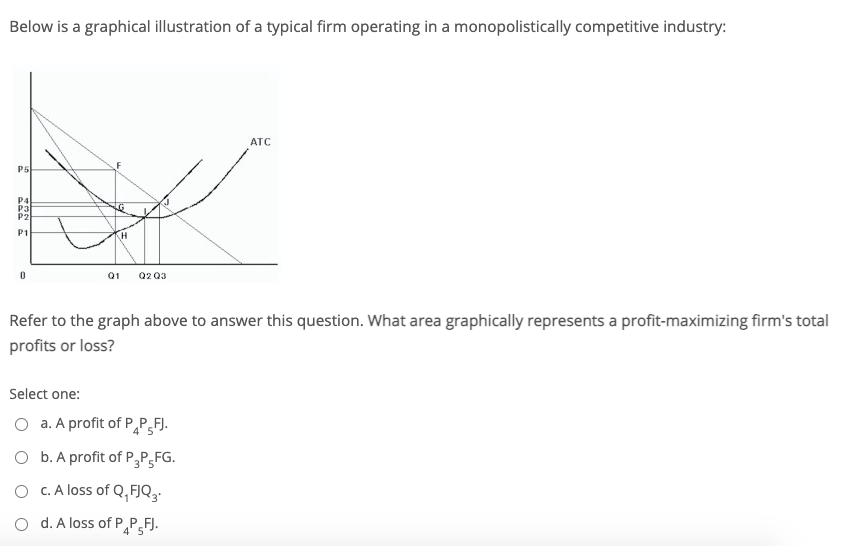
Below is a graphical illustration of a typical firm operating in a monopolistically competitive industry: ATC P5 PA P1 Q1 Q203 Refer to the graph above to answer this question. What area graphically represents a profit-maximizing firm's total profits or loss? Select one: O a. A profit of P P FJ. O b. A profit of P P FG. O C. A loss of Q FJQ3. O d. A loss of P P FJ
Step by Step Solution
There are 3 Steps involved in it
1 Expert Approved Answer
Step: 1 Unlock

Question Has Been Solved by an Expert!
Get step-by-step solutions from verified subject matter experts
Step: 2 Unlock
Step: 3 Unlock