

Question: Please see the below. Data collected on Monda TABLE QI-I. QUEUEING SYSTEM PARAMETERS AND PERFORMANCE IN PART a Question i. (25 points) QUEUEING ANALYSIS OF
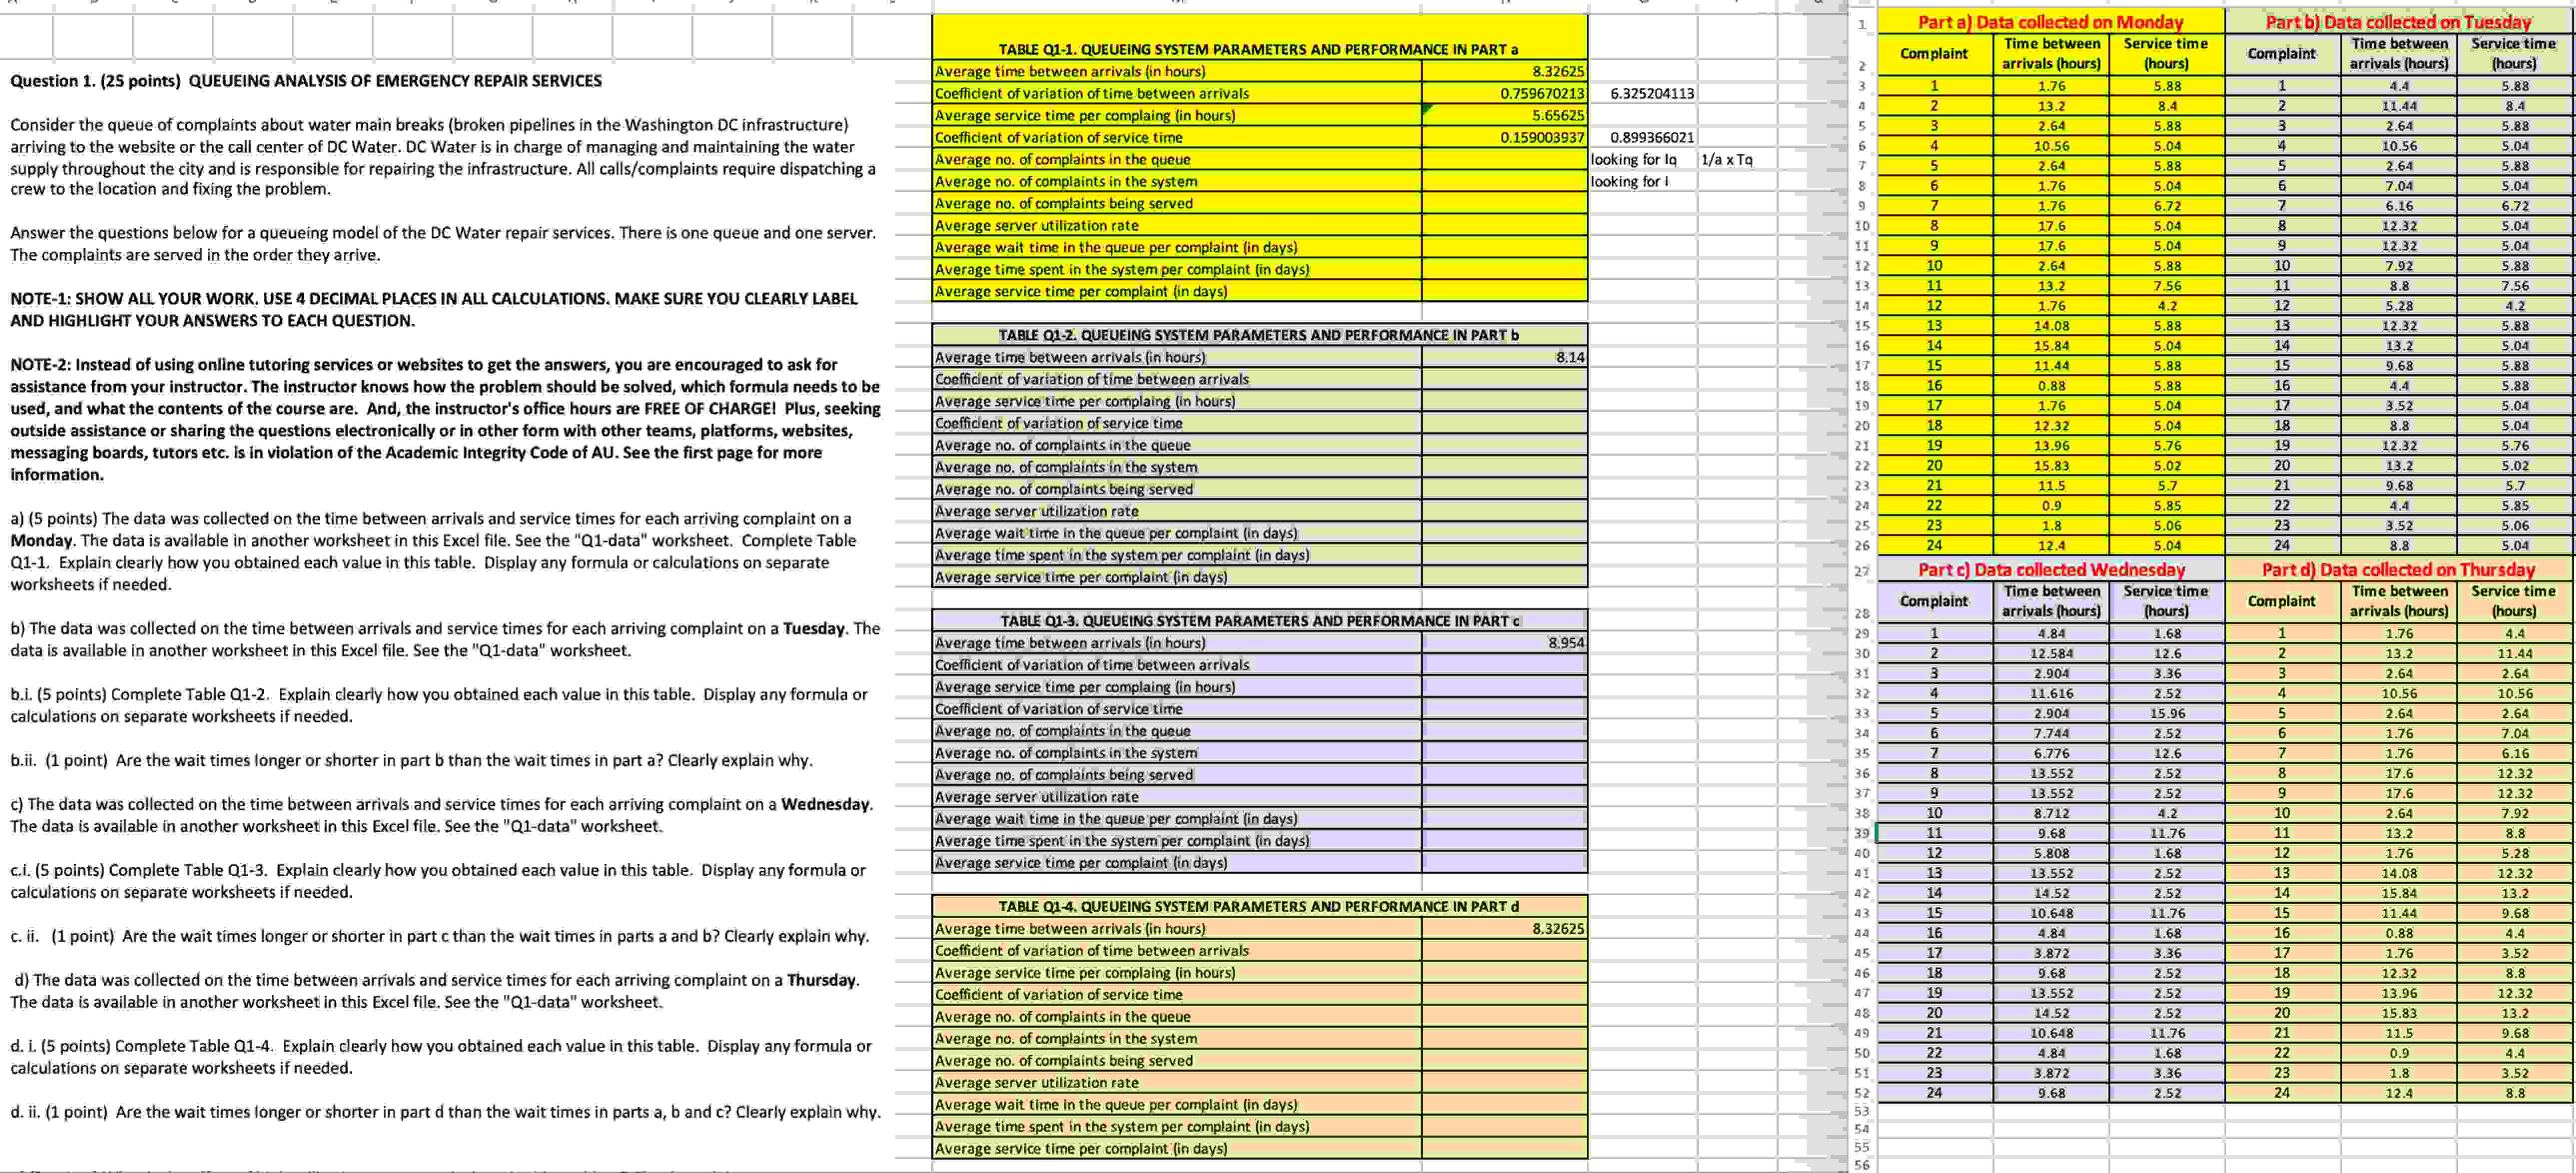
Data collected on Monda TABLE QI-I. QUEUEING SYSTEM PARAMETERS AND PERFORMANCE IN PART a Question i. (25 points) QUEUEING ANALYSIS OF EMERGENCY REPAIR SERVICES Consider the queue of complaints about water main breaks (broken pipelines in the WaShington DC infrastructure) arriving to the website or the call center of DC Water. DC Water is in charge of managing and maintaining the water supply throughout the city and is responsible for repairing the infrastructure, All calls/complaints require dispatching a crew to the location and fixing the problem. Answer the questions below for a queueing model of the DC Water repair services, There is one queue and one server. The complaints are served in the order they arrive. NOTE-I: SHOW ALL YOUR WORK. USE 4 DECIMAL PLACES IN AU CALCULATIONS. MAKE SURE YOU CLEARLY LABEL AND HIGHLIGHT YOUR ANSWERS TO EACH QUESTION. NOTE-2: Instead of using online tutoring services or websites to get the answers, you are encouraged to ask for assistance from your instructor. The instructor knows how the problem should be solved, which formula needs to be used, and what the contents of the course are. And; the instructor's office hours are FREE OF CHARGE! Plus, seeking outside assistance or sharing the questions electronically or in other form with other teams, platforms, websites, messaging boards, tutors etc. is in violation of the Academic Integrity Code of AU. See the first page for more information. a) (5 points) The data was collected on the time between arrivals and service times for each arriving complaint on a Monday, The dat is available in another Worksheet in this Excel file, See the "QI-datai' worksheet. Complete Table QI-I. Explain clearly how you obtained each value in this table. Display any formula or calculations on separate worksheets if needed. b) The dat Was collected on the time between arrivals and service times for each arriving complaint on a Tuesday. The data is available in another worksheet in this Excel file. See the 'A1-data" worksheet. b.i. (5 points) Complete Table QI-2. Explain clearly how you obtained each value in this table. Display any formula or calculations on separate worksheets if needed. b.ii. (I point) Are the wait times longer or shorter in part b than the waittimes in part a? Clearly explain why. C) The data was collected on the time between arrivals and service times for each arriving complaint on a Wednesday. The data is available in another worksheet in this Excel file. See the "QI-data" worksheet. c.i. (5 points) Complete Table QI-3. Explain clearly how you obtained each value in this table. Display any formula or calculations on separate worksheets if needed. c. ii. (I point) Are the wait times longer or shorter in part c than the wait times in parts a and b? Clearly explain why. d) The dat was collected on the time between arrivals and service times for each arriving complaint on a Thursday, The data is available in another worksheet in this Excel file. See the "QI-data" worksheet. d. i. (5 points) Complete Table QI-4. Explain clearly how you obtained each value in this table. Display any formula or calculations on separate worksheets if needed. d. ii, (1 point) Are the wait times longer or shorter in part d than the waittimes in parts a, b and c? Clearly explain Why. 6.3252041131 0.899366021' looking for Iq II/a x Tq looking for I 1 5 6 8 10 16 21 22 23 25 26 27 29 30 36 39 50 53 55 56 Part a Complaint 1 2 3 4 5 6 7 8 9 10 11 12 13 14 15 16 17 18 19 20 21 22 23 24 Part b Complaint 1 2 3 4 5 6 7 8 9 10 11 12 13 14 15 16 17 18 19 20 21 22 23 24 Data collected on Tuesda Average time between arrivals (in hours) Coefficient of variation of time between arrivals Average service time per complaing (in hours) Coefficient of variation of service time Average no. of complaints in the queue Average no. of complaints in the system Average no. of complaints being served Average server utilization rate Average wait time in the queue per complaint (in days) Average time spent in the system per complaint (in days) Average service time per complaint (in days) 8.32625 0.759670213 5.65625 0.159003937 TABLE QI-2. QUEUEING SYSTEM PAMMETERS AND PERFORMANCE IN PART b Average time between arrivals (in hours) Coefficient of variation of tinte between arrivals Average service time per complaing (in hours) Coefficient of variation of service time Average nov of complaints in the queue Average no, of complaints4n the system Average nov of complaints being served Average serverutilization rate Average wait time in the queue per complaint (in days) Average time spent 'in the system per complaint (in days) Average service time per complaint (in days) TABLE QI-3. QUEUEING SYSTEM PARAMETERS AND PERFORMANCE IN PARTc Average tinte between arrivals (in hours) Coefficient of variation of time between arrivals Average service time per complaing (in hours) Coefficient of variation of service time Average no, of complaints'in the queue Average nov of complaints in the system Average no, of complaints being served Average server utilization rate Average wait time in the queue 'per cornpiaint (in days) Average time spent in the system per complaint (in days) Average service time per complaint (in days) TABLE Q14. QUEUEING SYSTEM PARAMETERS AND PERFORMANCE IN PART d Average time between arrivals (in hours) Coefficient of variation of time between arrivals Average service time per complaing (in hours) Coefficient of variation of service time Average no. ofcomp!aints in the queue Average no. of complaints in the system Average no. of complaints being served Average server utilization rate Average wait time in the queue er complaint (in days) Average time spent in the system per complaint (in days) Average service time per complaint (in days) Time between arrivals (hours) 1.76 13.2 2.64 10.56 2.64 1.76 1.76 17.6 17.6 2.64 13.2 1.76 14.08 15.84 11.44 0.88 1.76 12.32 13.96 15.83 11.5 0.9 1.8 12.4 Service tim e (hours) 5.88 8.4 5.88 5.04 5.88 5.04 6.72 5.04 5.04 5.88 7.56 4.2 5.88 5.04 5.88 5.88 5.04 5.04 5.76 5.02 5.7 5.85 5.06 5.04 Time between arrivals (hours) 4.4 i i .44 2.64 iO.S6 2.64 7.04 6.16 12.32 12.32 7.92 8.8 5.28 12.32 13.2 9.68 4.4 3.52 8.8 12.32 13.2 9.68 4.4 3.52 8.8 Service time (hours) 5.88 8.4 5.88 5.04 5.88 5.04 6.72 5.04 5.04 5.88 7.56 4.2 5.88 5.04 5.88 5.88 5.04 5.04 5.76 5.02 5.7 5.85 5.06 5.04 8.14 8,954 8.32625 Part c) Data collected Wednesda Part d Data collected on Thursda Time between Service time Complaint 1 2 3 4 5 6 7 8 9 10 11 12 13 14 15 16 17 18 19 20 21 22 23 24 arrivals (hours) 4.84 12.584 2.904 ii.6i6 2.904 7.744 6.776 13.552 13.552 8.712 9.68 5.808 13.552 .52 10.648 a .84 3.872 9.68 13.552 .52 10.648 a .84 3.872 9.68 (hours) 1.68 12.6 3.36 2.52 15.96 2.52 12.6 2.52 2.52 4.2 11.76 1.68 2.52 2.52 11.76 1.68 3.36 2.52 2.52 2.52 11.76 1.68 3.36 2.52 Complaint 1 2 3 4 5 6 7 8 9 10 11 12 13 14 15 16 18 19 20 21 22 23 24 Time between arrivals (hours) 1.76 13.2 2.64 10.56 2.64 1.76 1.76 17.6 17.6 2.64 13.2 1.76 14.08 15.84 11.44 0.88 1.76 12.32 13.96 15.83 11.5 0.9 1.8 12.4 Service time (hours) 4.4 11.44 2.64 10.56 2.64 7.04 6.16 12.32 12.32 7.92 8.8 5.28 12.32 13.2 9.68 4.4 3.52 8.8 12.32 13.2 9.68 4.4 3.52 8.8
Step by Step Solution
There are 3 Steps involved in it

Get step-by-step solutions from verified subject matter experts