

Question: Please see the Matlab code below. I need three plots. One of VBWP, one of VBWB, and another of VII where each line plot graphs
Please see the Matlab code below. I need three plots. One of VBWP, one of VBWB, and another of VII where each line plot graphs all three vector components separately (X, Y, and Z) against the time provided in the data file. Also, see below for plot form.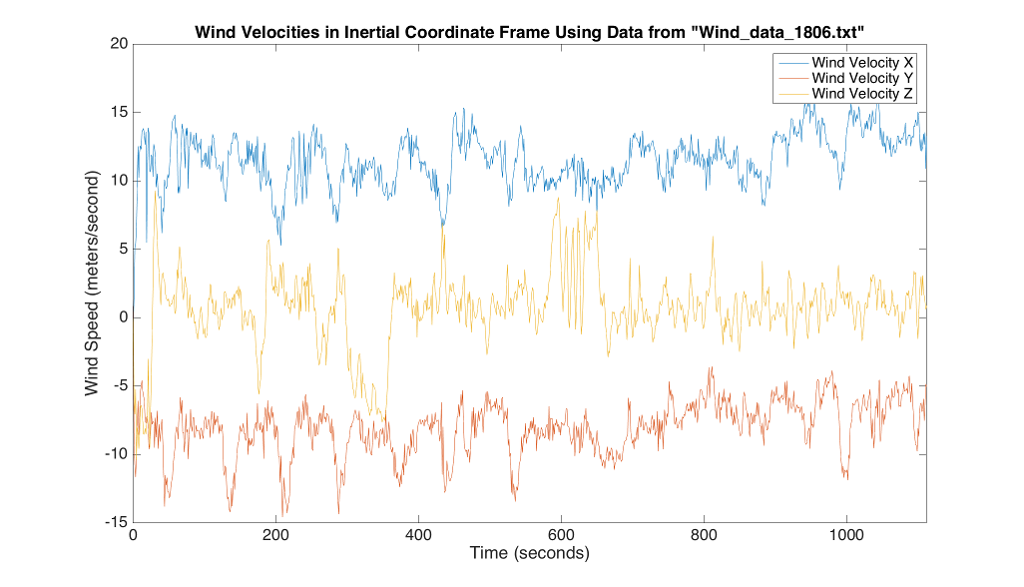
file_name = 'Wind_data_1806.txt';
data = readtable(file_name, 'Delimiter', '\t');
data = table2array(data);
[row_number, col_number] = size(data);
for row=1:row_number
time = data(row,1);
airspeed = data(row,2);
alpha= data(row,3);
beta= data(row,4);
UAx= data(row,5);
UAy= data(row,6);
UAz= data(row,7);
phi= data(row,8);
theta= data(row,9);
psi= data(row,10);
roll= data(row,11);
pitch= data(row,12);
yaw= data(row,13);
%------------------------Part A-------------------------%
A=[cosd(alpha) 0 -sind(alpha); 0 1 0; sind(alpha) 0 cosd(alpha)];
B=[cosd(beta) -sind(beta) 0; sind(beta) cosd(beta) 0; 0 0 1];
C=[airspeed; 0; 0];
VBPW= A*B*C;
VBWP= -VBPW;
%------------------------Part B-------------------------%
Angular=[roll; pitch; yaw];
Position= [0.30; -0.79; 0.13];
VBPB = cross(Angular,Position);
VBWB= VBWP-VBPB;
%------------------------Part C-------------------------
UA= [UAx; UAy; UAz];
D= [1 0 0; 0 cos(phi) sin(phi); 0 -sin(phi) cos(phi)];
E= [cos(theta) 0 sin(theta); 0 1 0; -sin(theta) 0 cos(theta)];
F= [cos(psi) sin(psi) 0; -sin(psi) cos(psi) 0; 0 0 1];
RIB= D*E*F;
RBI= inv(RIB);
VII= UA+ RBI*(VBPB- VBPW);
end
Wind Velocities in Inertial Coordinate Frame Using Data from "Wind_data 1806.txt" 20 Wind Velocity X Wind Velocity Y Wind Velocity Z 2 15 5 0 5 -10 -15 0 200 400 600 0 800 1000 Time (seconds) Wind Velocities in Inertial Coordinate Frame Using Data from "Wind_data 1806.txt" 20 Wind Velocity X Wind Velocity Y Wind Velocity Z 2 15 5 0 5 -10 -15 0 200 400 600 0 800 1000 Time (seconds)
Step by Step Solution
There are 3 Steps involved in it

Get step-by-step solutions from verified subject matter experts