

Question: please see the multiple choice at the end and answer from there. thank you Next we estimate a probit model and obtain the following results:
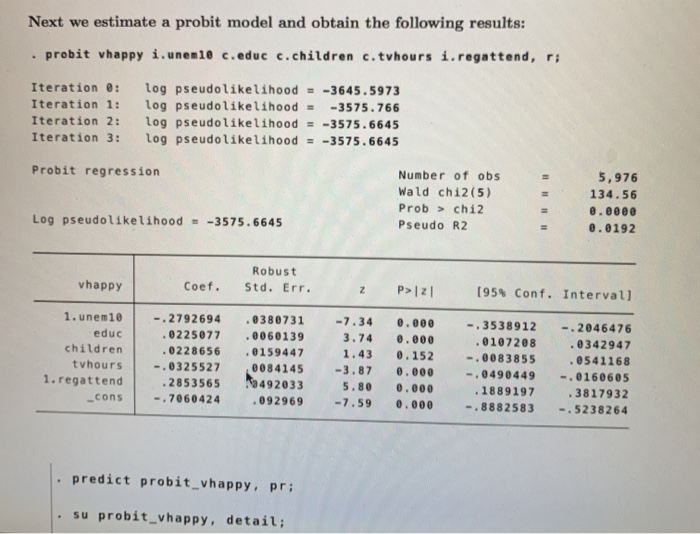
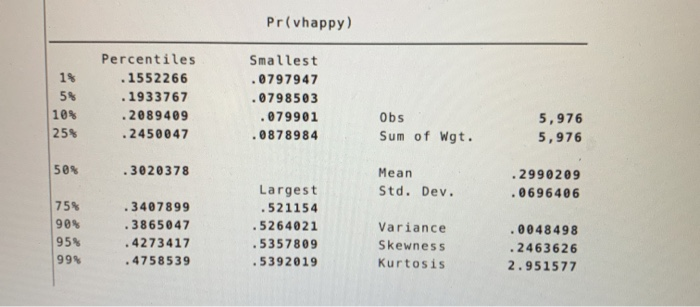
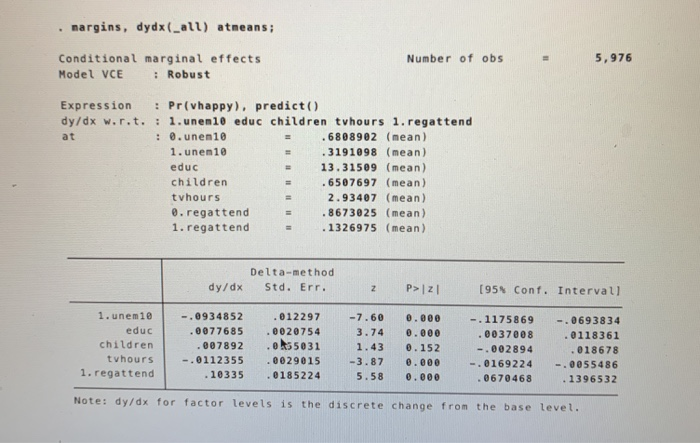
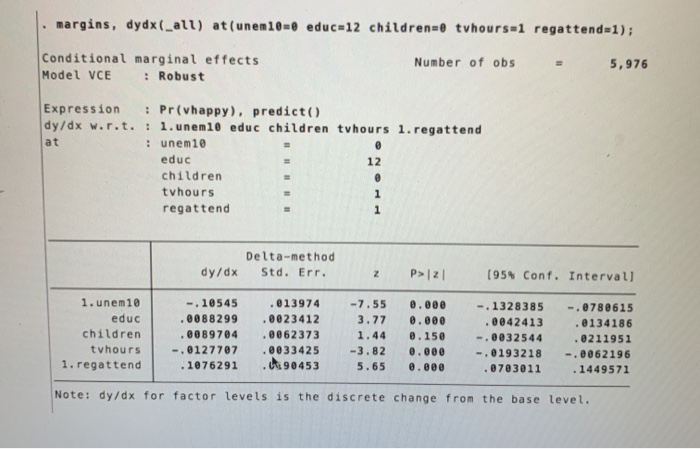
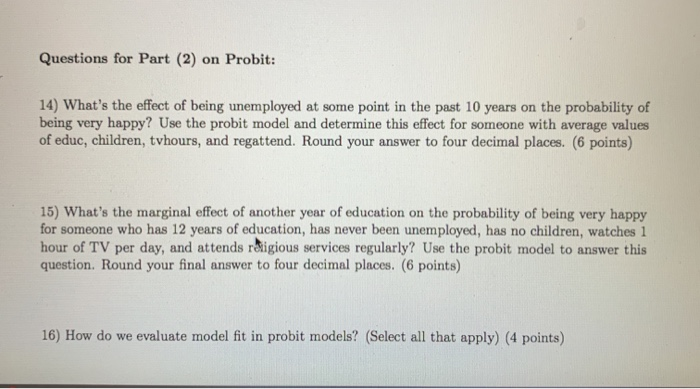
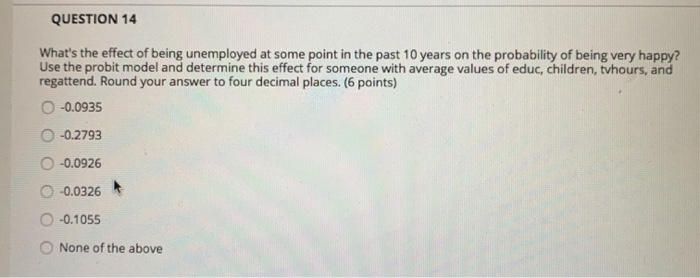
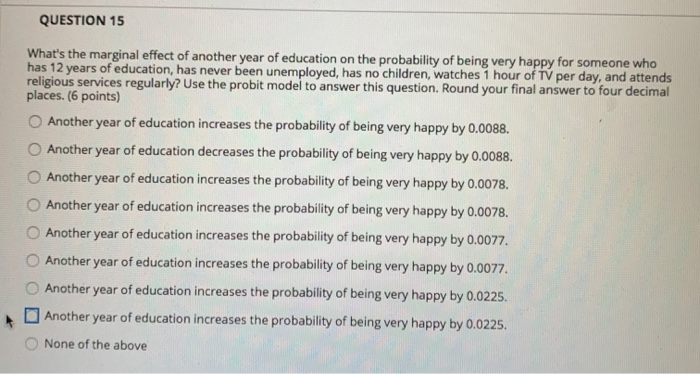

Next we estimate a probit model and obtain the following results: probit vhappy i.unen10 c.educ c.children c. tvhours i.regattend, r; Iteration : Iteration 1: Iteration 2: Iteration 3 : log pseudolikelihood = -3645.5973 log pseudolikelihood = -3575.766 log pseudolikelihood = -3575.6645 log pseudolikelihood = -3575.6645 Probit regression Number of obs Wald chi2 (5) Prob > chi2 Pseudo R2 5,976 134.56 @.0000 0.0192 Log pseudolikelihood = -3575.6645 = vhappy Coef. Robust Std. Err. Z P>12 (95% Conf. Intervall 1.unem 10 educ children tvhours 1. regattend cons -.2792694 .0225077 0228656 -.0325527 2853565 -.7060424 . 0380731 . 0060139 .0159447 0084145 19492033 .092969 -7.34 3.74 1.43 -3.87 5.80 -7.59 0.000 0.000 0.152 0.000 0.000 0.000 -.3538912 .0107208 -.0083855 -.0490449 .1889197 -.8882583 -.2046476 0342947 . 0541168 -.0160605 3817932 -.5238264 predict probit_vhappy, pr; su probit_vhappy, detail; Pr(vhappy) 1% 5% Percentiles . 1552 266 .1933767 .2089409 .2450047 Smallest .0797947 .0798503 .079901 .0878984 10% 25% Obs Sum of Wgt. 5,976 5,976 50% .3020378 Mean Std. Dev. 2990209 . 0696406 75% 90% 95% 99% 3407899 .3865047 .4273417 4758539 Largest .521154 5264021 .5357809 5392019 Variance Skewness Kurtosis . 0048498 .2463626 2.951577 . margins, dydx(_all) atmeans; Number of obs 5,976 Conditional marginal effects Model VCE : Robust Expression : Pr(vhappy), predict() dy/dx w.rit. : 1.unen 10 educ children tvhours 1. regattend at : 0.unen 10 6808902 (mean) 1. unen10 .3191098 (mean) educ 13.31509 (mean) children .6507697 (mean) tvhours 2.93407 (mean) 0. regattend .8673025 (mean) 1. regattend . 1326975 (mean) Delta-method dy/dx Std. Err. z P> 21 [95% Conf. Intervall 1.unem 10 educ children tvhours 1. regattend -.0934852 .0077685 .007892 -.0112355 . 10335 .012297 0020754 ek5031 0029015 0185224 -7.60 3.74 1.43 -3.87 5.58 0.000 0.000 0.152 0.000 0.000 -.1175869 . 0037008 -.002894 -.0169224 . 0670468 -.0693834 .0118361 .018678 -.0055486 . 1396532 Note: dy/dx for factor levels is the discrete change from the base level. Questions for Part (2) on Probit: 14) What's the effect of being unemployed at some point in the past 10 years on the probability of being very happy? Use the probit model and determine this effect for someone with average values of educ, children, tvhours, and regattend. Round your answer to four decimal places. (6 points) 15) What's the marginal effect of another year of education on the probability of being very happy for someone who has 12 years of education, has never been unemployed, has no children, watches 1 hour of TV per day, and attends rtigious services regularly? Use the probit model to answer this question. Round your final answer to four decimal places. (6 points) 16) How do we evaluate model fit in probit models? (Select all that apply) (4 points) QUESTION 14 What's the effect of being unemployed at some point in the past 10 years on the probability of being very happy? Use the probit model and determine this effect for someone with average values of educ, children, tvhours, and regattend. Round your answer to four decimal places. (6 points) -0.0935 -0.2793 -0.0926 -0.0326 0 -0.1055 None of the above QUESTION 15 What's the marginal effect of another year of education on the probability of being very happy for someone who has 12 years of education, has never been unemployed, has no children, watches 1 hour of TV per day, and attends religious services regularly? Use the probit model to answer this question. Round your final answer to four decimal places. (6 points) Another year of education increases the probability of being very happy by 0.0088. Another year of education decreases the probability of being very happy by 0.0088. Another year of education increases the probability of being very happy by 0.0078. Another year of education increases the probability of being very happy by 0.0078. Another year of education increases the probability of being very happy by 0.0077. Another year of education increases the probability of being very happy by 0.0077. Another year of education increases the probability of being very happy by 0.0225. Another year of education increases the probability of being very happy by 0.0225. None of the above QUESTION 16 How do we evaluate model fit in probit models? (Select all that apply) (4 points) Pseudo R2 R2 Adjusted R2 Percent correctly predicted SER F-statistic Next we estimate a probit model and obtain the following results: probit vhappy i.unen10 c.educ c.children c. tvhours i.regattend, r; Iteration : Iteration 1: Iteration 2: Iteration 3 : log pseudolikelihood = -3645.5973 log pseudolikelihood = -3575.766 log pseudolikelihood = -3575.6645 log pseudolikelihood = -3575.6645 Probit regression Number of obs Wald chi2 (5) Prob > chi2 Pseudo R2 5,976 134.56 @.0000 0.0192 Log pseudolikelihood = -3575.6645 = vhappy Coef. Robust Std. Err. Z P>12 (95% Conf. Intervall 1.unem 10 educ children tvhours 1. regattend cons -.2792694 .0225077 0228656 -.0325527 2853565 -.7060424 . 0380731 . 0060139 .0159447 0084145 19492033 .092969 -7.34 3.74 1.43 -3.87 5.80 -7.59 0.000 0.000 0.152 0.000 0.000 0.000 -.3538912 .0107208 -.0083855 -.0490449 .1889197 -.8882583 -.2046476 0342947 . 0541168 -.0160605 3817932 -.5238264 predict probit_vhappy, pr; su probit_vhappy, detail; Pr(vhappy) 1% 5% Percentiles . 1552 266 .1933767 .2089409 .2450047 Smallest .0797947 .0798503 .079901 .0878984 10% 25% Obs Sum of Wgt. 5,976 5,976 50% .3020378 Mean Std. Dev. 2990209 . 0696406 75% 90% 95% 99% 3407899 .3865047 .4273417 4758539 Largest .521154 5264021 .5357809 5392019 Variance Skewness Kurtosis . 0048498 .2463626 2.951577 . margins, dydx(_all) atmeans; Number of obs 5,976 Conditional marginal effects Model VCE : Robust Expression : Pr(vhappy), predict() dy/dx w.rit. : 1.unen 10 educ children tvhours 1. regattend at : 0.unen 10 6808902 (mean) 1. unen10 .3191098 (mean) educ 13.31509 (mean) children .6507697 (mean) tvhours 2.93407 (mean) 0. regattend .8673025 (mean) 1. regattend . 1326975 (mean) Delta-method dy/dx Std. Err. z P> 21 [95% Conf. Intervall 1.unem 10 educ children tvhours 1. regattend -.0934852 .0077685 .007892 -.0112355 . 10335 .012297 0020754 ek5031 0029015 0185224 -7.60 3.74 1.43 -3.87 5.58 0.000 0.000 0.152 0.000 0.000 -.1175869 . 0037008 -.002894 -.0169224 . 0670468 -.0693834 .0118361 .018678 -.0055486 . 1396532 Note: dy/dx for factor levels is the discrete change from the base level. Questions for Part (2) on Probit: 14) What's the effect of being unemployed at some point in the past 10 years on the probability of being very happy? Use the probit model and determine this effect for someone with average values of educ, children, tvhours, and regattend. Round your answer to four decimal places. (6 points) 15) What's the marginal effect of another year of education on the probability of being very happy for someone who has 12 years of education, has never been unemployed, has no children, watches 1 hour of TV per day, and attends rtigious services regularly? Use the probit model to answer this question. Round your final answer to four decimal places. (6 points) 16) How do we evaluate model fit in probit models? (Select all that apply) (4 points) QUESTION 14 What's the effect of being unemployed at some point in the past 10 years on the probability of being very happy? Use the probit model and determine this effect for someone with average values of educ, children, tvhours, and regattend. Round your answer to four decimal places. (6 points) -0.0935 -0.2793 -0.0926 -0.0326 0 -0.1055 None of the above QUESTION 15 What's the marginal effect of another year of education on the probability of being very happy for someone who has 12 years of education, has never been unemployed, has no children, watches 1 hour of TV per day, and attends religious services regularly? Use the probit model to answer this question. Round your final answer to four decimal places. (6 points) Another year of education increases the probability of being very happy by 0.0088. Another year of education decreases the probability of being very happy by 0.0088. Another year of education increases the probability of being very happy by 0.0078. Another year of education increases the probability of being very happy by 0.0078. Another year of education increases the probability of being very happy by 0.0077. Another year of education increases the probability of being very happy by 0.0077. Another year of education increases the probability of being very happy by 0.0225. Another year of education increases the probability of being very happy by 0.0225. None of the above QUESTION 16 How do we evaluate model fit in probit models? (Select all that apply) (4 points) Pseudo R2 R2 Adjusted R2 Percent correctly predicted SER F-statistic
Step by Step Solution
There are 3 Steps involved in it

Get step-by-step solutions from verified subject matter experts