

Question: Please see the picture below. Shown is a partial computer output from a regression analysis done on the data from table 1. Tablel. Y XI
Please see the picture below.
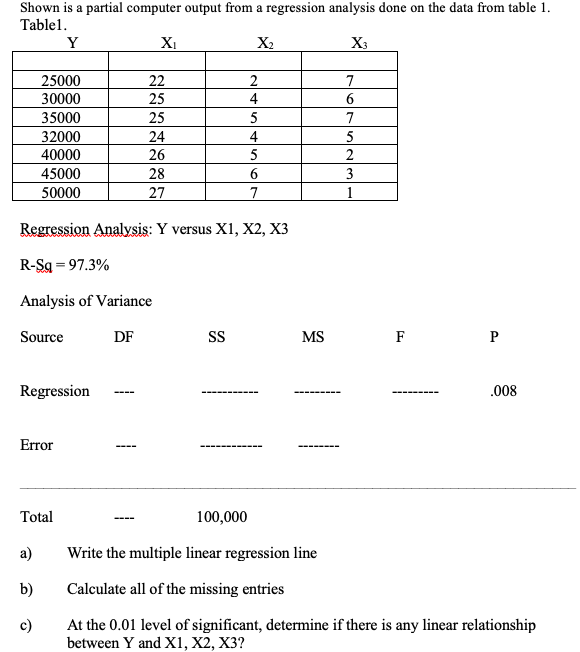
Shown is a partial computer output from a regression analysis done on the data from table 1. Tablel. Y XI X2 X3 25000 22 30000 25 35000 AN 25 32000 24 40000 26 45000 28 U NU JO - 50000 27 Regression Analysis: Y versus X1, X2, X3 R-Sq =97.3% Analysis of Variance Source DF SS MS F P Regression ---- 008 Error Total 100,000 a) Write the multiple linear regression line b) Calculate all of the missing entries c) At the 0.01 level of significant, determine if there is any linear relationship between Y and X1, X2, X3
Step by Step Solution
There are 3 Steps involved in it
1 Expert Approved Answer
Step: 1 Unlock

Question Has Been Solved by an Expert!
Get step-by-step solutions from verified subject matter experts
Step: 2 Unlock
Step: 3 Unlock