

Question: PLEASE SEE THE PICTURE CAN YOU WRITE THE EXPLAIN IT STEP BY STEP, THANK YOU SO MUCH Khan Ltd Income Statement For the year ended
PLEASE SEE THE PICTURE
CAN YOU WRITE THE EXPLAIN IT STEP BY STEP, THANK YOU SO MUCH
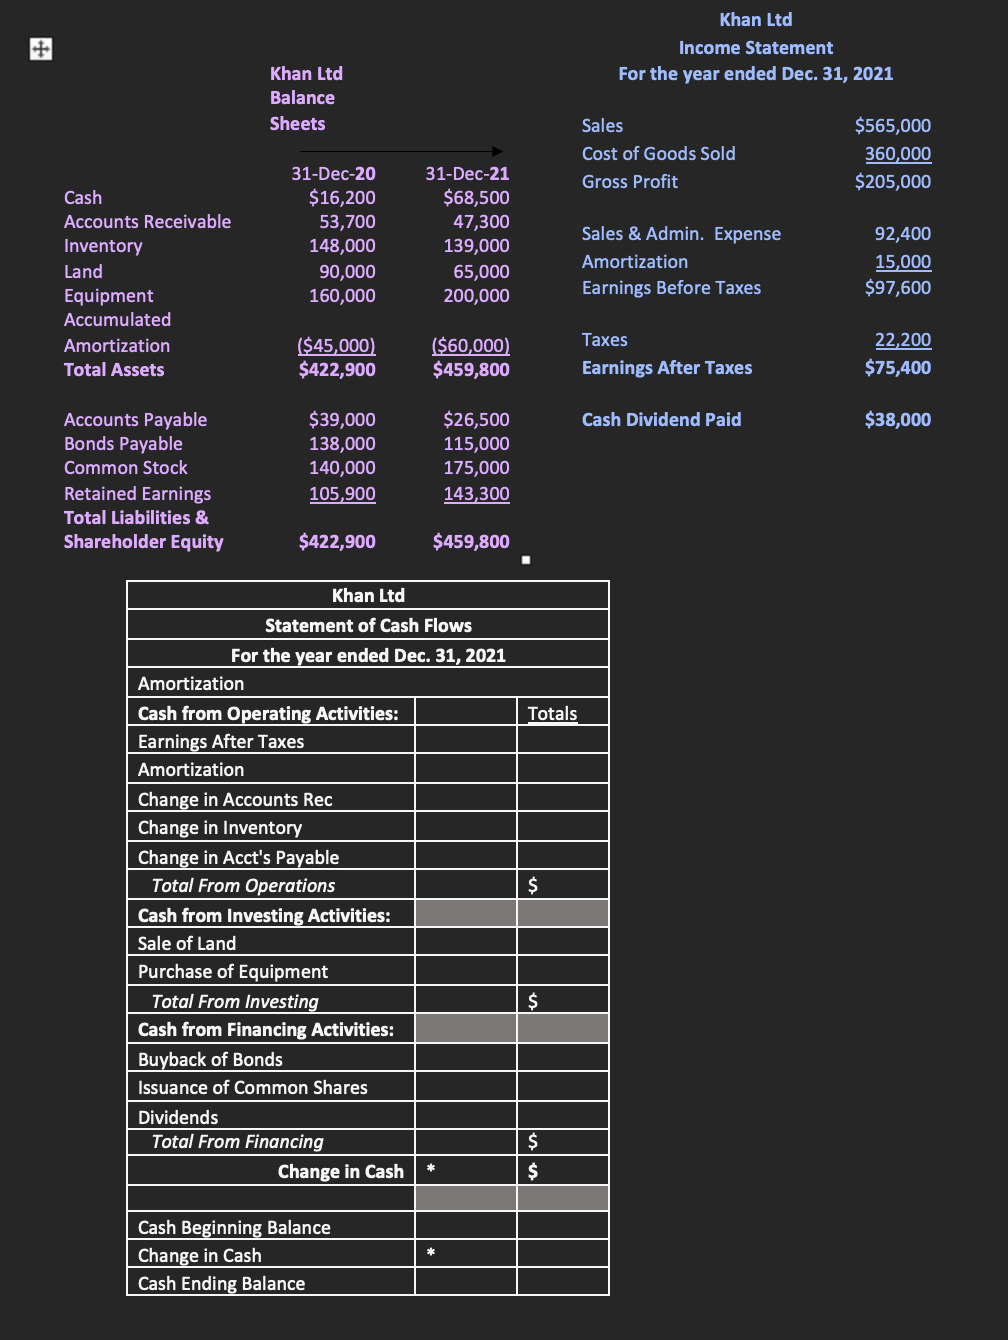
Khan Ltd Income Statement For the year ended Dec. 31, 2021 Khan Ltd Balance Sheets Sales Cost of Goods Sold Gross Profit $565,000 360,000 $205,000 Cash Accounts Receivable Inventory Land Equipment Accumulated Amortization Total Assets 31-Dec-20 $16,200 53,700 148,000 90,000 160,000 31-Dec-21 $68,500 47,300 139,000 65,000 200,000 Sales & Admin. Expense Amortization Earnings Before Taxes 92,400 15,000 $97,600 ($45,000) $422,900 ($60,000) $459,800 Taxes Earnings After Taxes 22,200 $75,400 Cash Dividend Paid $38,000 Accounts Payable Bonds Payable Common Stock Retained Earnings Total Liabilities & Shareholder Equity $39,000 138,000 140,000 105,900 $26,500 115,000 175,000 143,300 $422,900 $459,800 Totals Khan Ltd Statement of Cash Flows For the year ended Dec. 31, 2021 Amortization Cash from Operating Activities: Earnings After Taxes Amortization Change in Accounts Rec Change in Inventory Change in Acct's Payable Total From Operations Cash from Investing Activities: Sale of Land Purchase of Equipment Total From Investing Cash from Financing Activities: Buyback of Bonds Issuance of Common Shares Dividends Total From Financing Change in Cash $ $ $ $ Cash Beginning Balance Change in Cash Cash Ending Balance
Step by Step Solution
There are 3 Steps involved in it

Get step-by-step solutions from verified subject matter experts