

Question: Please see the picture with the question Data were collected on many different variables of a fast food chain's sandwiches several years ago, Two variables
Please see the picture with the question
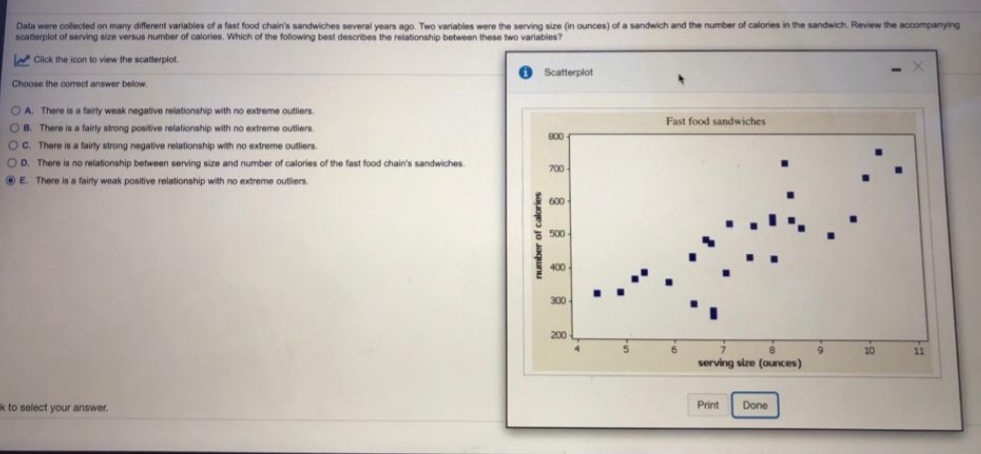
Data were collected on many different variables of a fast food chain's sandwiches several years ago, Two variables were the serving size (in ounces) of a sandwich and the number of calories in the sandwich. Review the accompanying scatterplot of serving size versus number of calories. Which of the following best describes the relationship between these two variables? Click the icon to view the scatterplot. Scatterplot - X Choose the correct answer below, O A. There is a fairly weak negative relationship with no extreme outliers. O B. There is a fairly strong positive relationship with no extreme outliers, Fast food sandwiches O C. There is a fairly strong negative relationship with no extreme outliers, O D. There is no relationship between serving size and number of calories of the fast food chain's sandwiches 700 E. There is a fairly weak positive relationship with no extreme outliers. number of calories 600 500 400 300 200 7 9 10 11 serving size (ounces) k to select your answer. Print Done
Step by Step Solution
There are 3 Steps involved in it

Get step-by-step solutions from verified subject matter experts