

Question: Please see the question below. Use the following graph. 6. (Learning Outcome 1) Use the following graph, which shows the types of incidents encountered with
Please see the question below. Use the following graph.
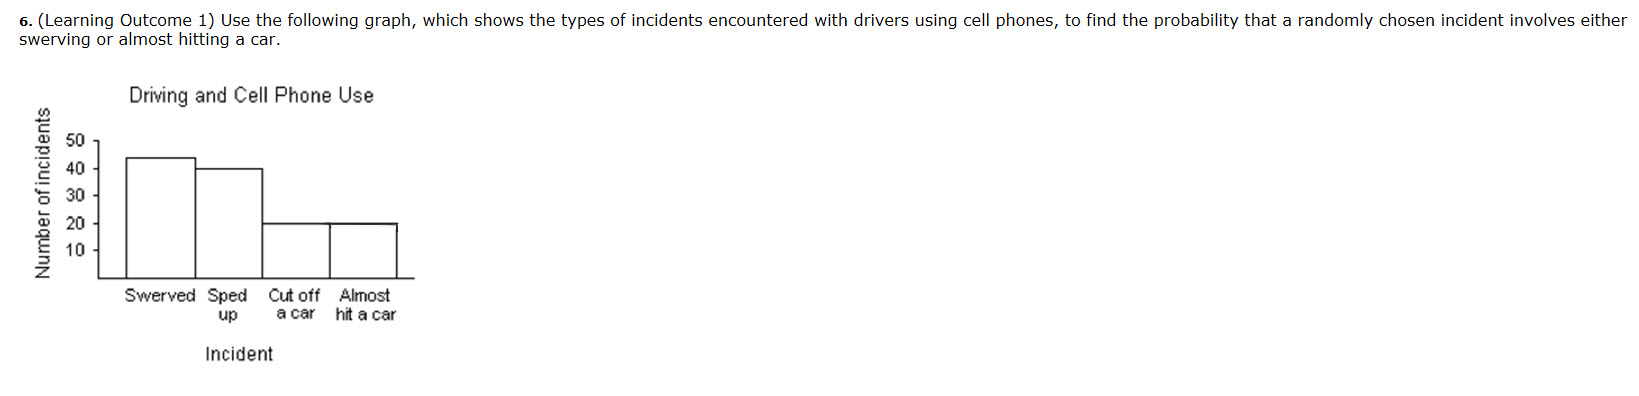
6. (Learning Outcome 1) Use the following graph, which shows the types of incidents encountered with drivers using cell phones, to nd the probability that a randomly chosen incident involves either swerving or almost hitting a car. Driving and Cell Phone Use 450' DD '9 U Nun-bar ofincldenis E 8 Swerved Spud Cutoff Aims! up 808! linear Incldeni
Step by Step Solution
There are 3 Steps involved in it
1 Expert Approved Answer
Step: 1 Unlock

Question Has Been Solved by an Expert!
Get step-by-step solutions from verified subject matter experts
Step: 2 Unlock
Step: 3 Unlock