

Question: Please see the screenshots below for the assignment In the Portfolio Excel Template accompanying this assignment you have data about 5 Vanguard mutual funds during

Please see the screenshots below for the assignment
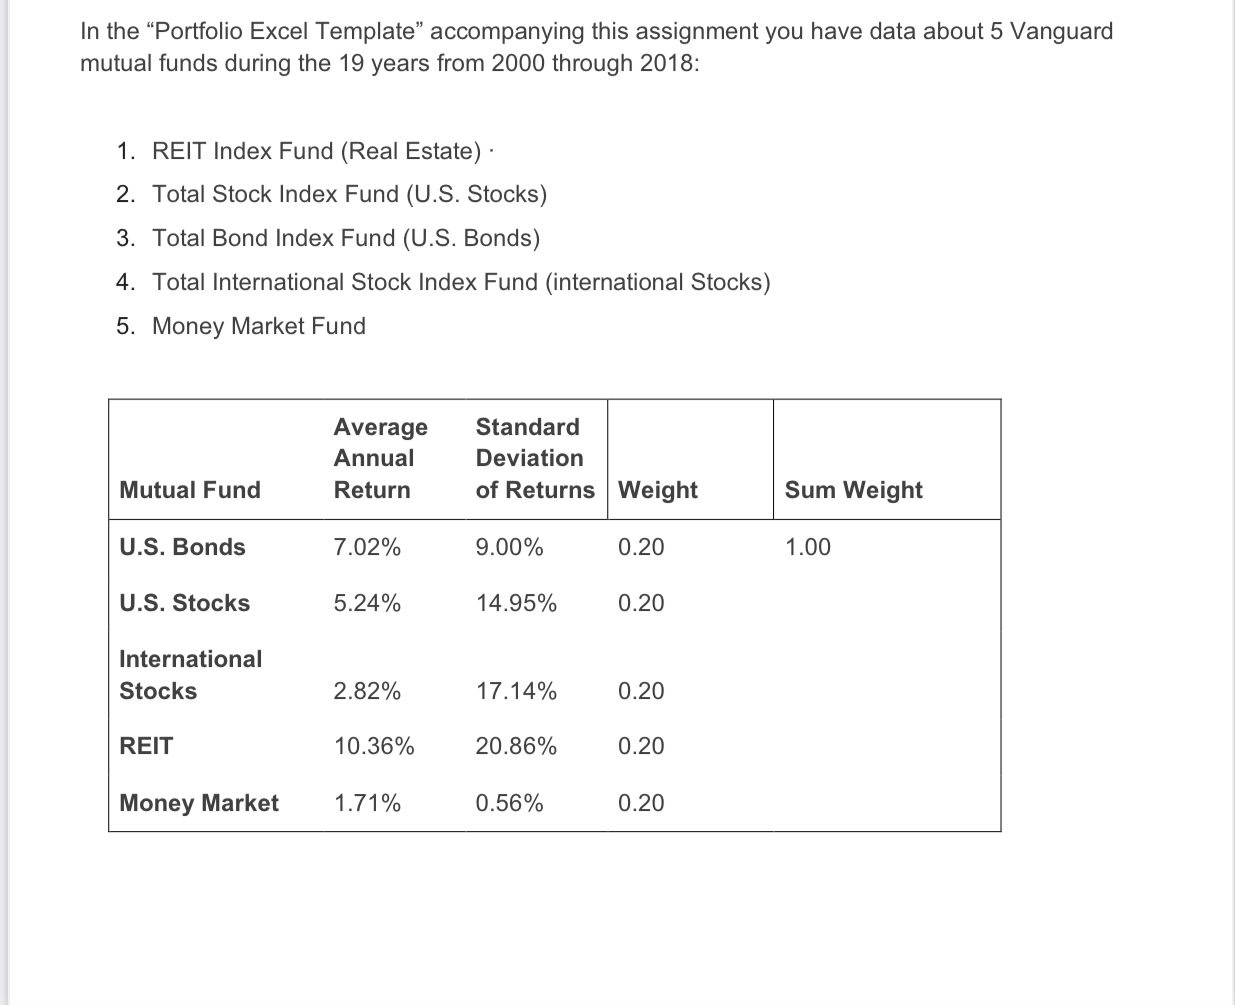


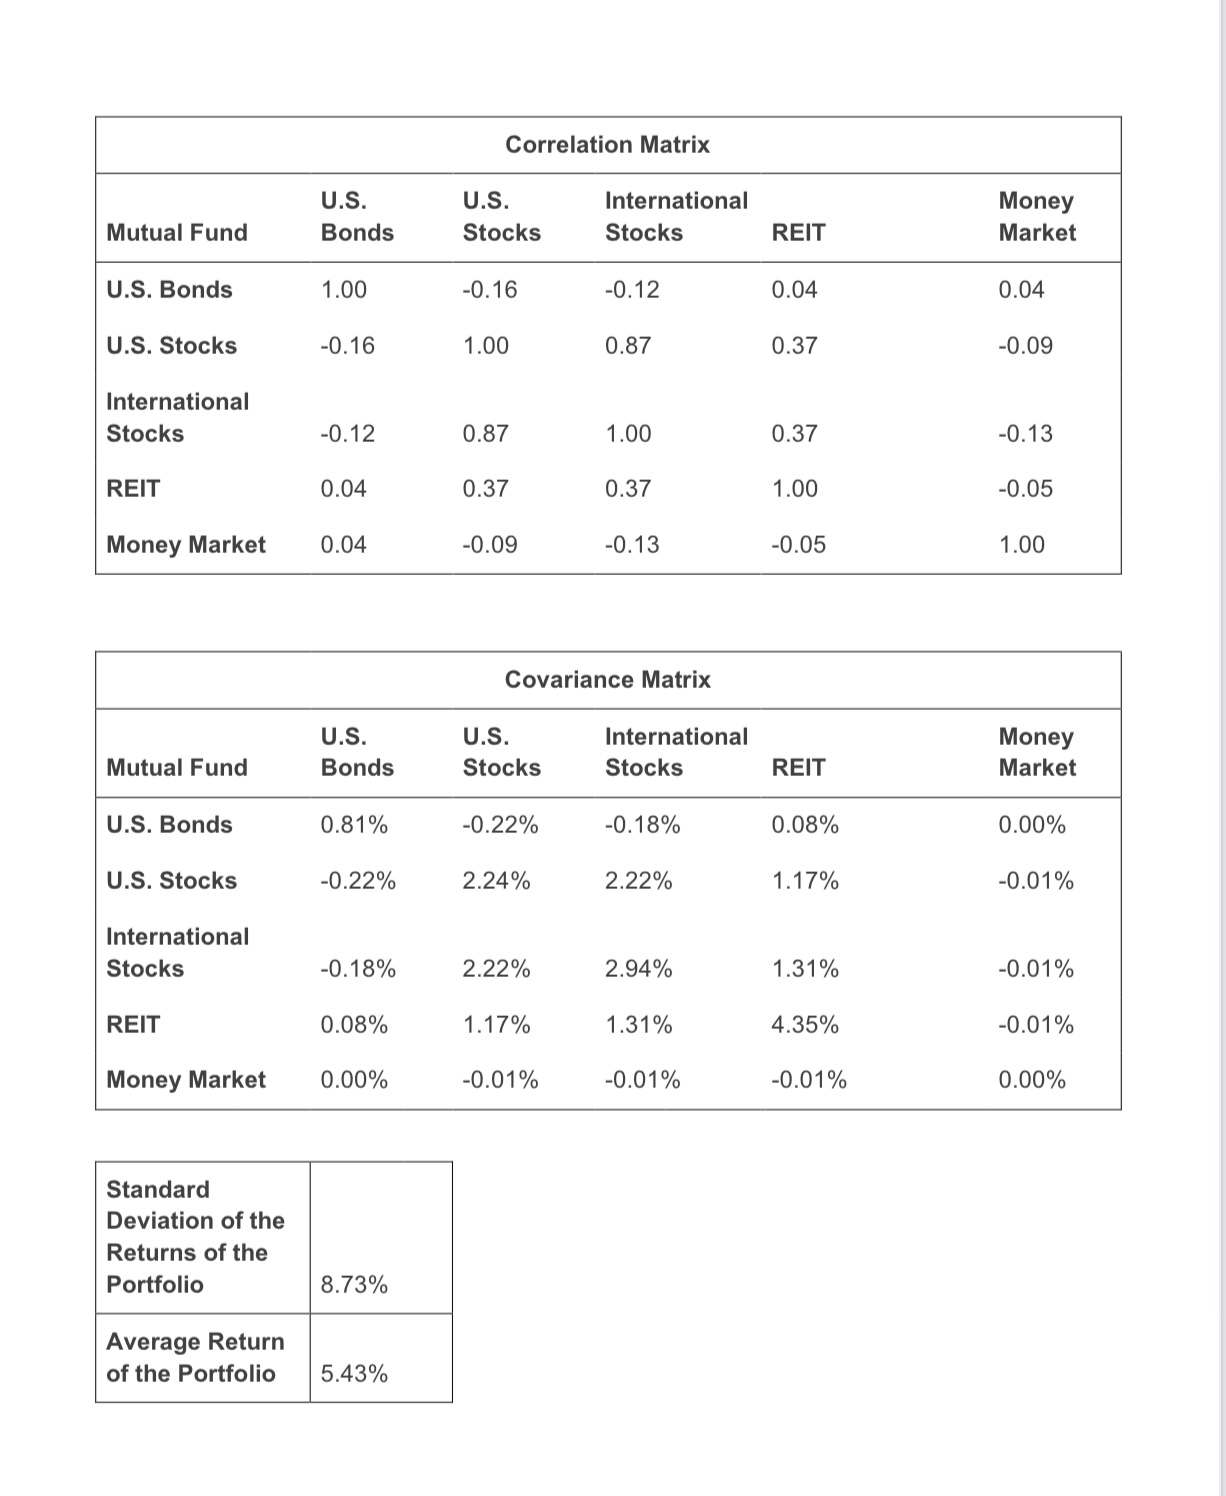
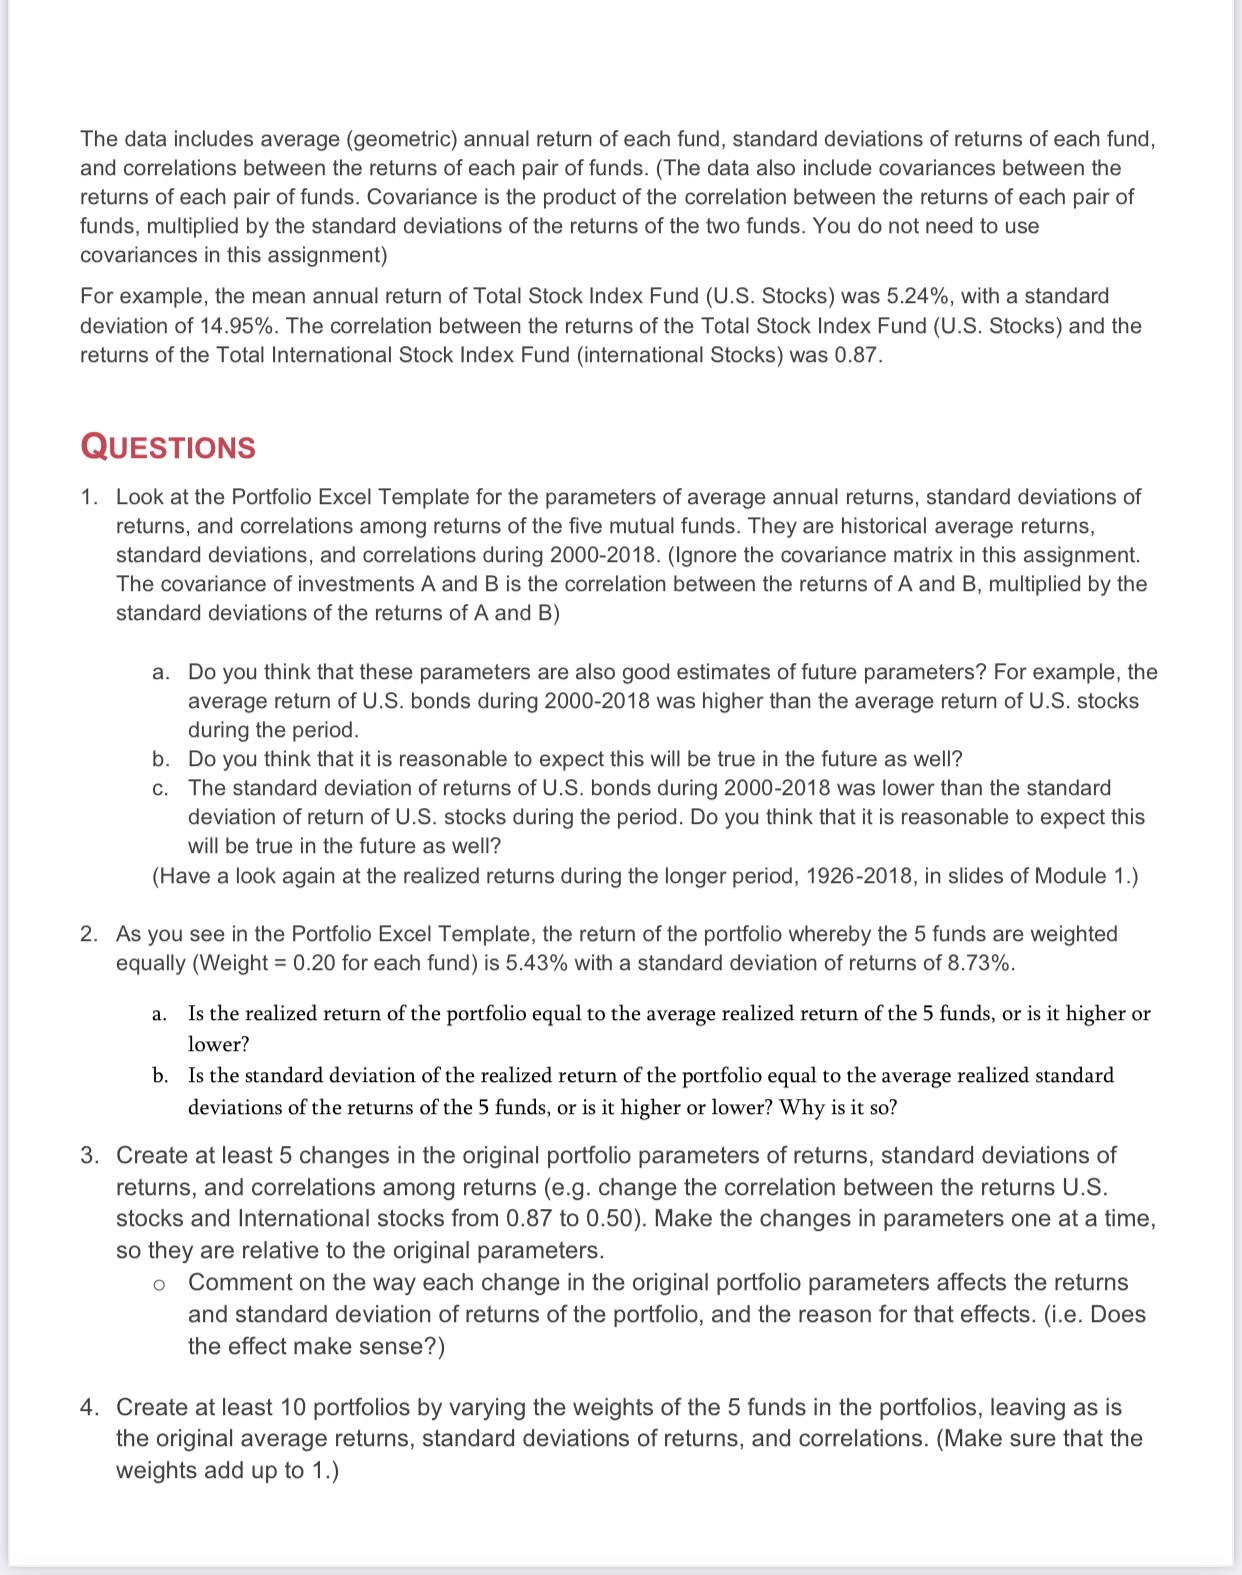
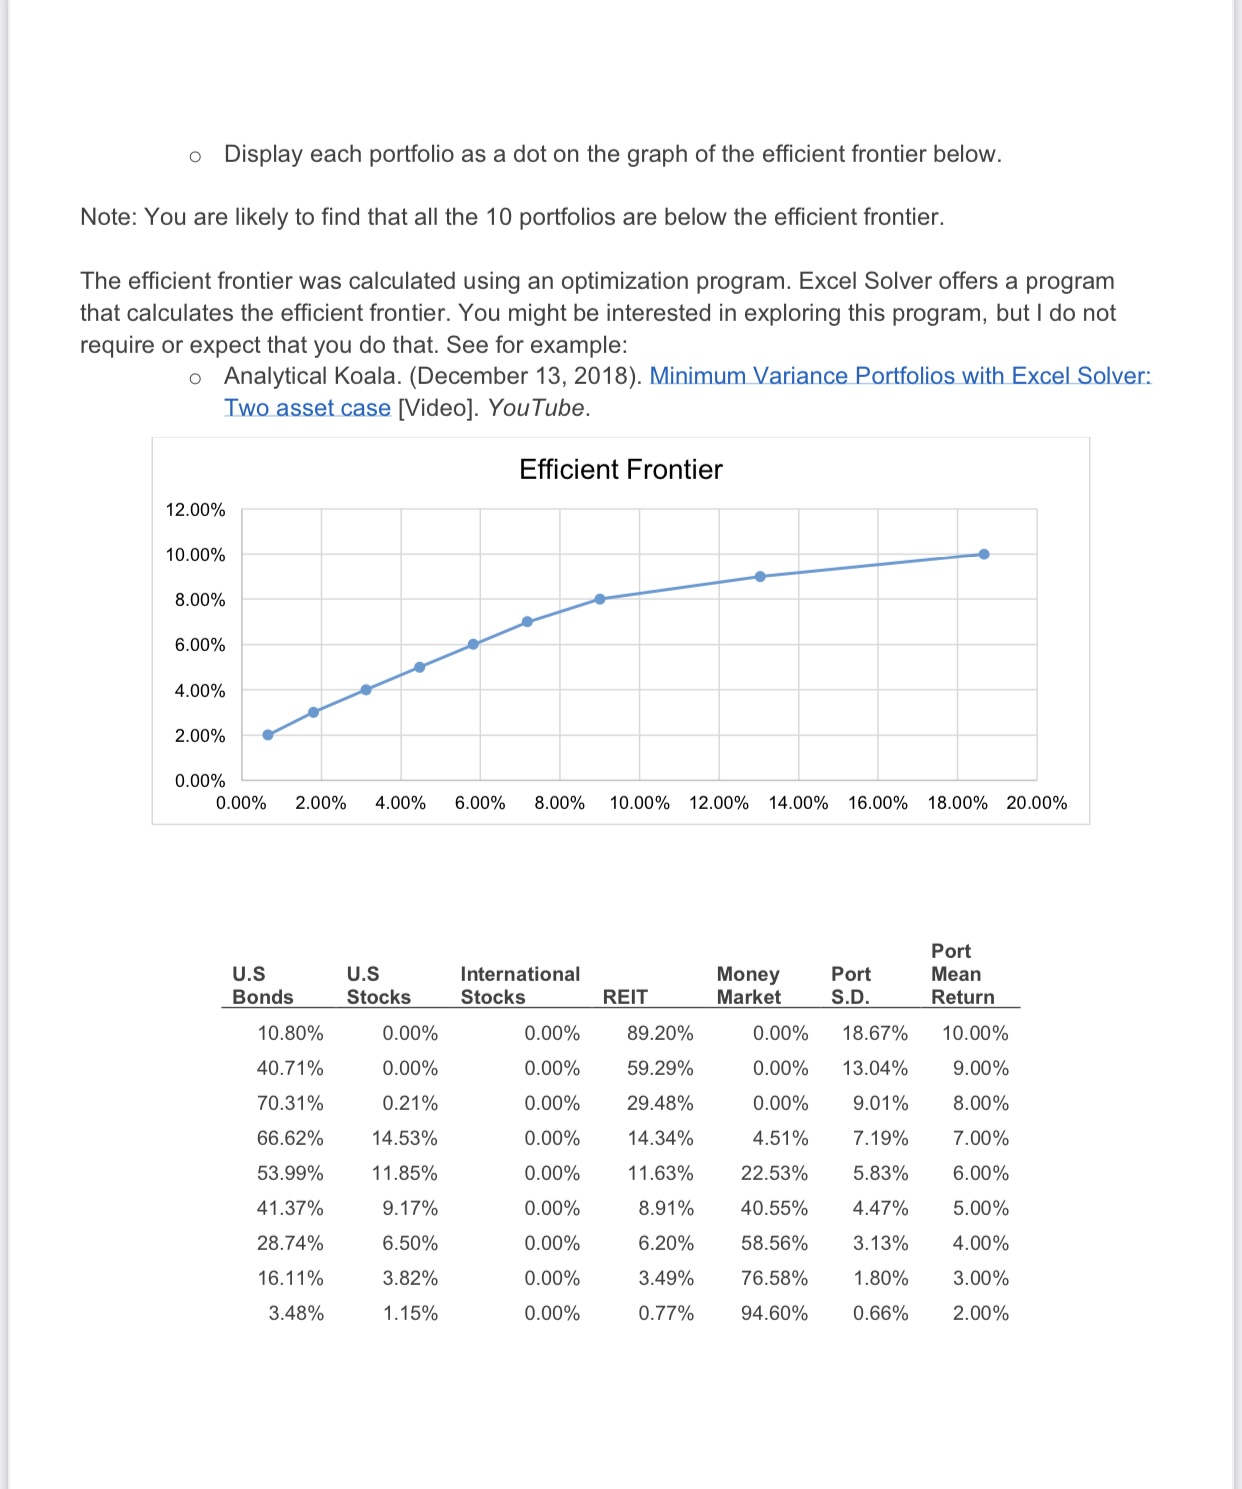
In the \"Portfolio Excel Template\" accompanying this assignment you have data about 5 Vanguard mutual funds during the 19 years from 2000 through 2018: 1. REIT Index Fund (Real Estate) - 2. Total Stock Index Fund (U.S. Stocks) 3. Total Bond Index Fund (U.S. Bonds) 4. Total International Stock Index Fund (international Stocks) 5 . Money Market Fund Average Standard Annual Deviation Mutual Fund Return of Returns Weight Sum Weight U.S. Bonds 7.02% 9.00% 0.20 1.00 U.S. Stocks 5.24% 14.95% 0.20 International Stocks 2.82% 17.14% 0.20 REIT 10.36% 20.86% 0.20 Money Market 1.71% 0.56% 0.20 Correlation Matrix U.S. U.S. International Money Mutual Fund Bonds Stocks Stocks REIT Market U.S. Bonds . -0.16 11.8. Stocks 1.00 International Stocks 0.87 REIT . 0.37 Money Market . -0.09 Covariance Matrix U.S. U.S. International Mutual Fund Bonds Stocks Stocks REIT U.S. Bonds 0.81% -0.22% U.S. Stocks -0.22% 2.24% International Stocks -0.18% 2.22% REIT 0.08% 1.17% Money Market 0.00% -0.01% Standard Deviation of the Returns of the Portfolio 8.73% Average Return of the Portfolio 5.43% The data includes average (geometric) annual return of each fund, standard deviations of returns of each fund. and correlations between the returns of each pair of funds. (The data also include covariances between the returns of each pair of funds. Covariance is the product of the correlation between the returns of each pair of funds, multiplied by the standard deviations of the returns of the two funds. You do not need to use covariances in this assignment) For example. the mean annual return of Total Stock Index Fund (US. Stocks) was 5.24%. with a standard deviation of 14.95%. The correlation between the returns of the Total Stock Index Fund (US. Stocks) and the returns of the Total lntemational Stock Index Fund (international Stocks) was 0.87. QUESTIONS 1. Look at the Portfolio Excel Template for the parameters of average annual returns. standard deviations of returns. and correlations among returns of the ve mutual funds. They are historical average returns, standard deviations. and correlations during 2000-2018. (Ignore the covariance matrix in this assignment. The covariance of investments A and B is the correlation between the returns of A and B, multiplied by the standard deviations of the returns of A and B) a. Do you think that these parameters are also good estimates of future parameters? For example, the average return of US. bonds during 2000-2018 was higher than the average return of US. stocks during the period. b. Do you think that it is reasonable to expect this will be true in the future as well? c. The standard deviation of returns of US. bonds during 2000-2018 was lower than the standard deviation of return of US. stocks during the period. Do you think that it is reasonable to expect this will be true in the future as well? (Have a look again at the realized returns during the longer period. 1926-2018. in slides of Module 1.) As you see in the Portfolio Excel Template, the return of the portfolio whereby the 5 funds are weighted equally (Weight = 0.20 for each fund) is 5.43% with a standard deviation of returns of 8.73%. a. Is the realized return of the portfolio equal to the average realized return of the 5 funds. or is it higher or lower? b. Is the standard deviation of the realized return of the portfolio equal to the average realized standard deviations of the returns of the 5 funds, or is it higher or lower? Why is it so? . Create at least 5 changes in the original portfolio parameters of returns, standard deviations of returns, and correlations among returns (e.g. change the correlation between the returns US. stocks and International stocks from 0.87 to 0.50). Make the changes in parameters one at a time, so they are relative to the original parameters. 0 Comment on the way each change in the original portfolio parameters affects the returns and standard deviation of returns of the portfolio, and the reason for that effects. (Le. Does the effect make sense?) . Create at least 10 portfolios by varying the weights of the 5 funds in the portfolios, leaving as is the original average returns, standard deviations of returns. and correlations. (Make sure that the weights add up to 1.) o Display each portfolio as a dot on the graph of the efficient frontier below. Note: You are likely to find that all the 10 portfolios are below the efficient frontier. The efficient frontier was calculated using an optimization program. Excel Solver offers a program that calculates the efficient frontier. You might be interested in exploring this program, but I do not require or expect that you do that. See for example: o Analytical Koala. (December 13, 2018). Minimum Variance Portfolios with Excel Solver: Two asset case [Video]. You Tube. Efficient Frontier 12.00% 10.00% 8.00% 6.00% 4.00% 2.00% 0.00% 0.00% 2.00% 4.00% 6.00% 8.00% 10.00% 12.00% 14.00% 16.00% 18.00% 20.00% Port U.S U.S International Money Port Mean Bonds Stocks Stocks REIT Market S.D. Return 10.80% 0.00% 0.00% 89.20% 0.00% 18.67% 10.00% 40.71% 0.00% 0.00% 59.29% 0.00% 13.04% 9.00% 70.31% 0.21% 0.00% 29.48% 0.00% 9.01% 8.00% 66.62% 14.53% 0.00% 14.34% 4.51% 7.19% 7.00% 53.99% 11.85% 0.00% 11.63% 22.53% 5.83% 6.00% 41.37% 9.17% 0.00% 8.91% 40.55% 4.47% 5.00% 28.74% 6.50% 0.00% 6.20% 58.56% 3.13% 4.00% 16.11% 3.82% 0.00% 3.49% 76.58% 1.80% 3.00% 3.48% 1.15% 0.00% 0.77% 94.60% 0.66% 2.00%
Step by Step Solution
There are 3 Steps involved in it

Get step-by-step solutions from verified subject matter experts