

Question: please select from answers provided. 2. The bivariate table and the chi square test Andrea Phelps and her colleagues studied the role of religious practice
please select from answers provided.

![301: 1140-47.] Suppose you conduct a similar study using a sample of](https://s3.amazonaws.com/si.experts.images/answers/2024/07/668b96af9c60b_111668b96af895ad.jpg)
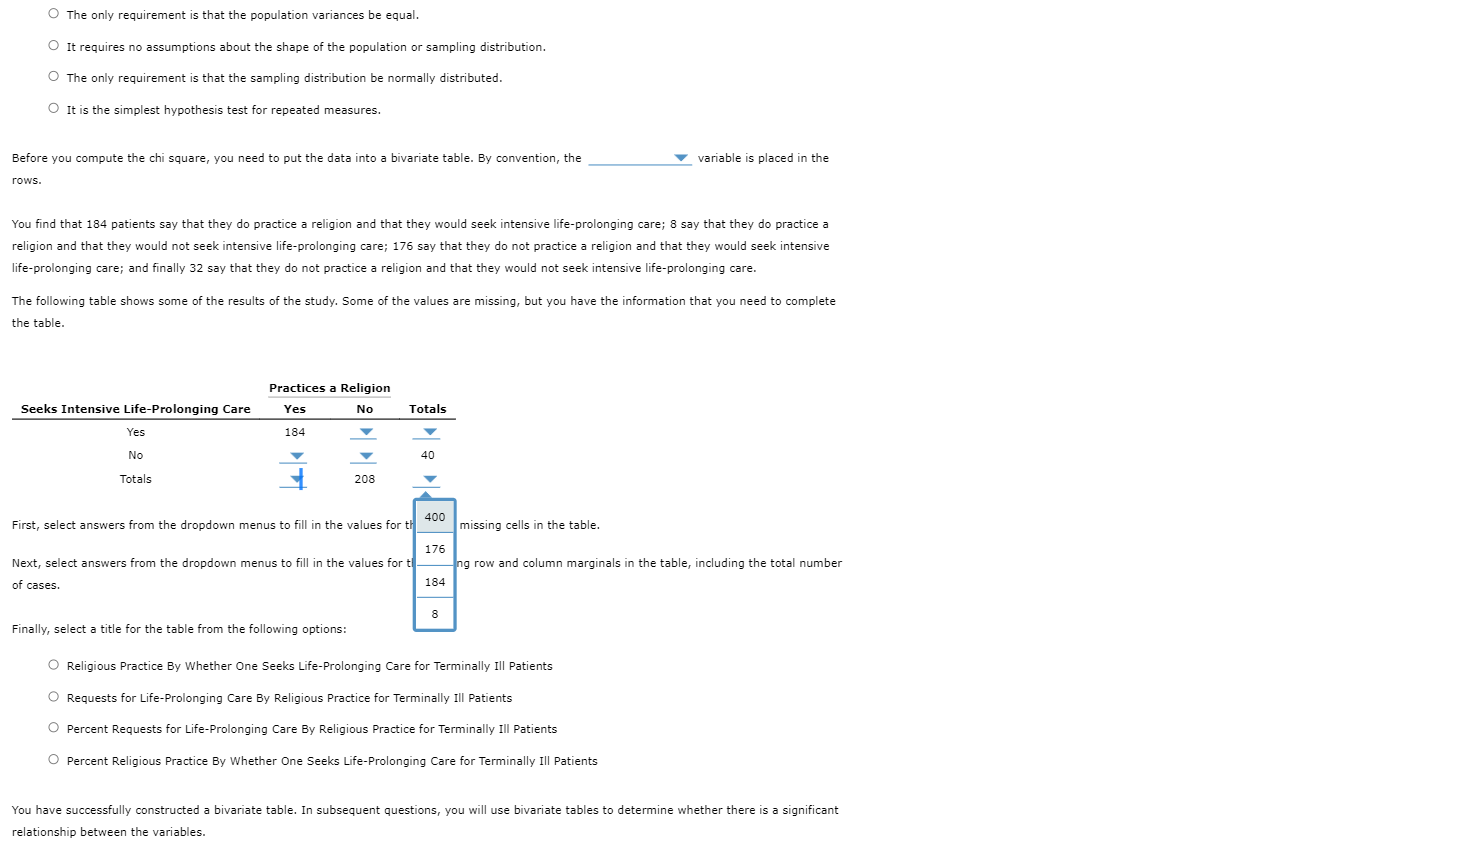
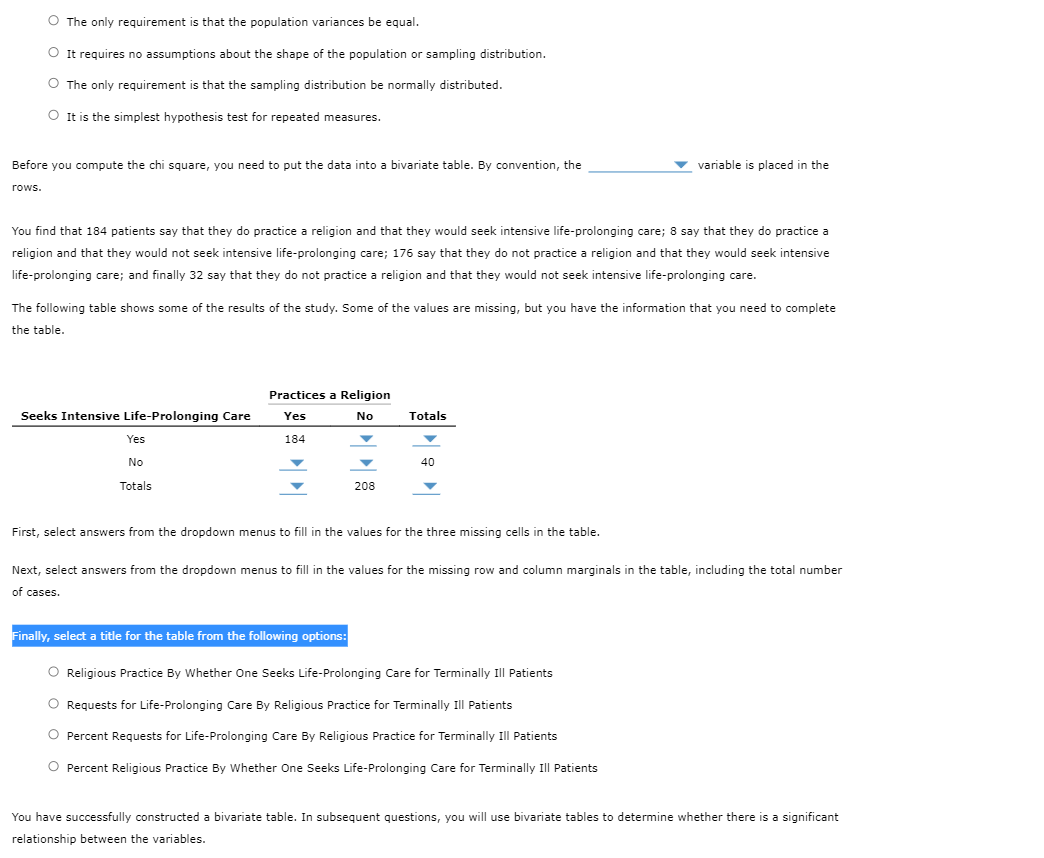
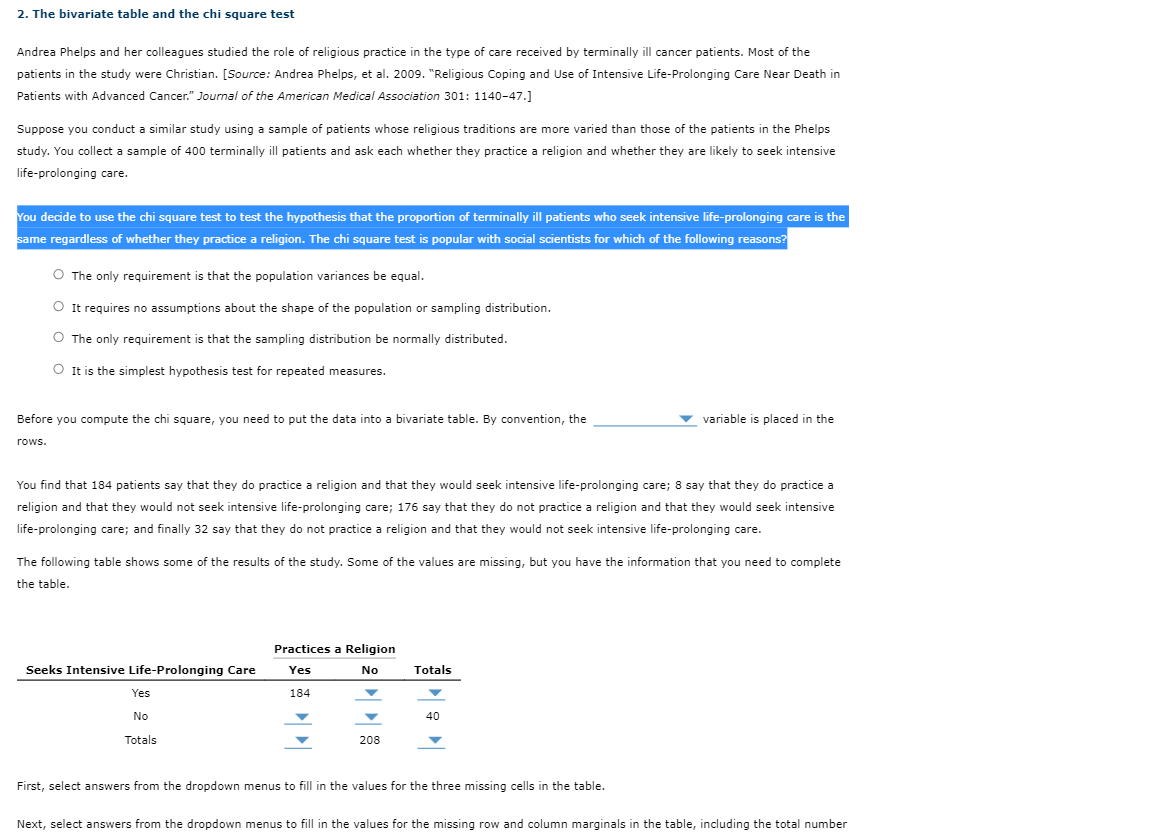
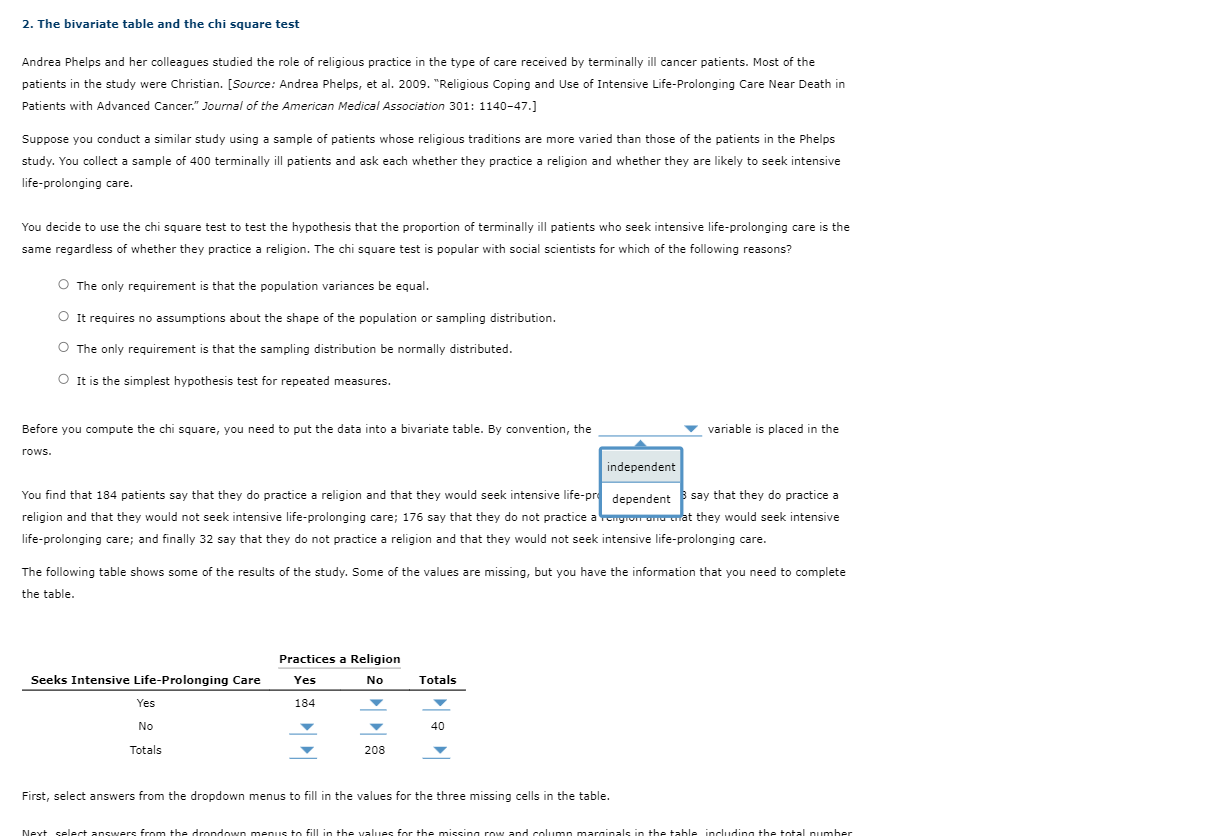
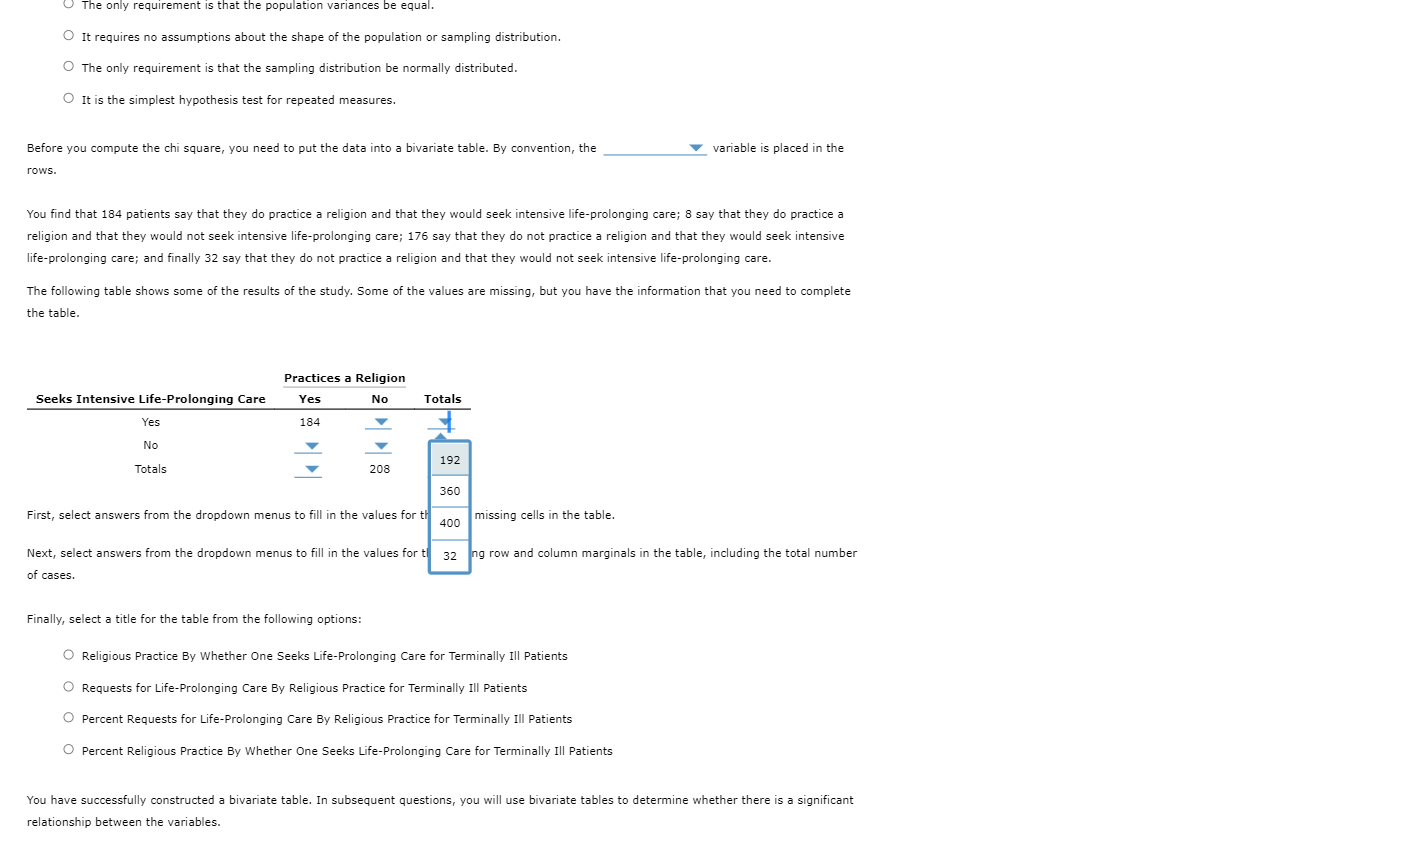
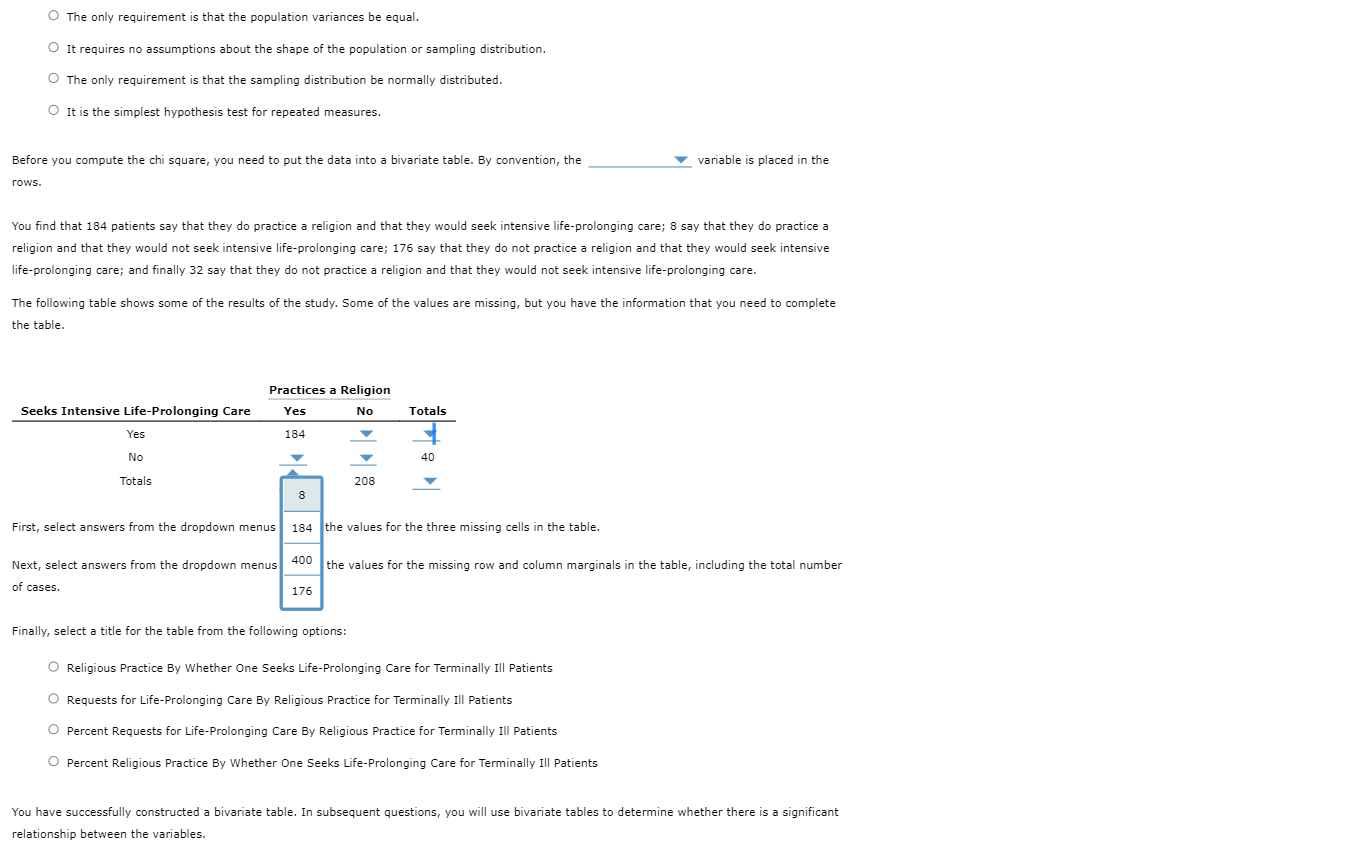
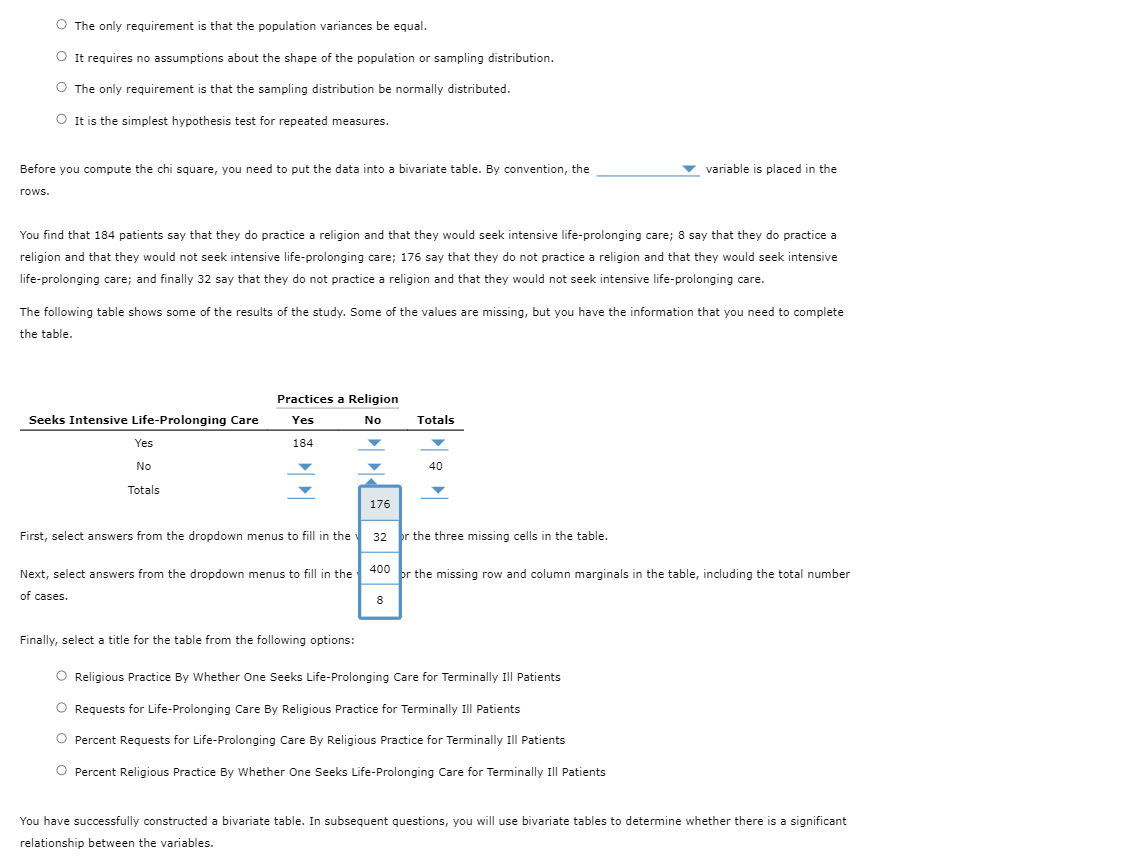
2. The bivariate table and the chi square test Andrea Phelps and her colleagues studied the role of religious practice in the type of care received by terminally ill cancer patients. Most of the patients in the study were Christian. [Source: Andrea Phelps, et al. 2009. "Religious Coping and Use of Intensive Life-Prolonging Care Near Death in Patients with Advanced Cancer." Journal of the American Medical Association 301: 1140-47.] Suppose you conduct a similar study using a sample of patients whose religious traditions are more varied than those of the patients in the Phelps study. You collect a sample of 400 terminally ill patients and ask each whether they practice a religion and whether they are likely to seek intensive life-prolonging care. You decide to use the chi square test to test the hypothesis that the proportion of terminally ill patients who seek intensive life-prolonging care is the same regardless of whether they practice a religion. The chi square test is popular with social scientists for which of the following reasons? The only requirement is that the population variances be equal. It requires no assumptions about the shape of the population or sampling distribution. The only requirement is that the sampling distribution be normally distributed. It is the simplest hypothesis test for repeated measures. Before you compute the chi square, you need to put the data into a bivariate table. By convention, the variable is placed in the owS. You find that 184 patients say that they do practice a religion and that they would seek intensive life-prolonging care; 8 say that they do practice a religion and that they would not seek intensive life-prolonging care; 176 say that they do not practice a religion and that they would seek intensive life-prolonging care; and finally 32 say that they do not practice a religion and that they would not seek intensive life-prolonging care. The following table shows some of the results of the study. Some of the values are missing, but you have the information that you need to complete the table. Practices a Religion Seeks Intensive Life-Prolonging Care Yes No Totals Yes 184 No 40 Totals 208 First, select answers from the dropdown menus to fill in the values for the three missing cells in the table. Next, select answers from the dropdown menus to fill in the values for the missing row and column marginals in the table, including the total number2. The bivariate table and the chi square test Andrea Phelps and her colleagues studied the role of religious practice in the type of care received by terminally ill cancer patients. Most of the patients in the study were Christian. [Source: Andrea Phelps, et al. 2009. "Religious Coping and Use of Intensive Life-Prolonging Care Near Death in Patients with Advanced Cancer." Journal of the American Medical Association 301: 1140-47.] Suppose you conduct a similar study using a sample of patients whose religious traditions are more varied than those of the patients in the Phelps study. You collect a sample of 400 terminally ill patients and ask each whether they practice a religion and whether they are likely to seek intensive life-prolonging care. You decide to use the chi square test to test the hypothesis that the proportion of terminally ill patients who seek intensive life-prolonging care is the same regardless of whether they practice a religion. The chi square test is popular with social scientists for which of the following reasons? The only requirement is that the population variances be equal. It requires no assumptions about the shape of the population or sampling distribution. O The only requirement is that the sampling distribution be normally distributed. O It is the simplest hypothesis test for repeated measures. Before you compute the chi square, you need to put the data into a bivariate table. By convention, the variable is placed in the rows. independent You find that 184 patients say that they do practice a religion and that they would seek intensive life-pre dependent 3 say that they do practice a religion and that they would not seek intensive life-prolonging care; 176 say that they do not practice a Yengrow and that they would seek intensive life-prolonging care; and finally 32 say that they do not practice a religion and that they would not seek intensive life-prolonging care. The following table shows some of the results of the study. Some of the values are missing, but you have the information that you need to complete the table. Practices a Religion Seeks Intensive Life-Prolonging Care Yes No Totals Yes 184 No 40 Totals 208 First, select answers from the dropdown menus to fill in the values for the three missing cells in the table.It requires no assumptions about the shape of the population or sampling distribution. O The only requirement is that the sampling distribution be normally distributed. O It is the simplest hypothesis test for repeated measures. Before you compute the chi square, you need to put the data into a bivariate table. By convention, the variable is placed in the rows. You find that 184 patients say that they do practice a religion and that they would seek intensive life-prolonging care; 8 say that they do practice a religion and that they would not seek intensive life-prolonging care; 176 say that they do not practice a religion and that they would seek intensive life-prolonging care; and finally 32 say that they do not practice a religion and that they would not seek intensive life-prolonging care. The following table shows some of the results of the study. Some of the values are missing, but you have the information that you need to complete the table. Practices a Religion Seeks Intensive Life-Prolonging Care Yes No Totals Yes 184 No 40 176 Totals 400 First, select answers from the dropdown menus to fill in the 184 or the three missing cells in the table. Next, select answers from the dropdown menus to fill in the 8 or the missing row and column marginals in the table, including the total number of cases. Finally, select a title for the table from the following options: O Religious Practice By Whether One Seeks Life-Prolonging Care for Terminally Ill Patients O Requests for Life-Prolonging Care By Religious Practice for Terminally Ill Patients Percent Requests for Life-Prolonging Care By Religious Practice for Terminally Ill Patients Percent Religious Practice By Whether One Seeks Life-Prolonging Care for Terminally Ill Patients You have successfully constructed a bivariate table. In subsequent questions, you will use bivariate tables to determine whether there is a significant elationship between the variables.The only requirement is that the population variances be equal. It requires no assumptions about the shape of the population or sampling distribution. The only requirement is that the sampling distribution be normally distributed. O It is the simplest hypothesis test for repeated measures. Before you compute the chi square, you need to put the data into a bivariate table. By convention, the variable is placed in the rows You find that 184 patients say that they do practice a religion and that they would seek intensive life-prolonging care; 8 say that they do practice a religion and that they would not seek intensive life-prolonging care; 176 say that they do not practice a religion and that they would seek intensive life-prolonging care; and finally 32 say that they do not practice a religion and that they would not seek intensive life-prolonging care. The following table shows some of the results of the study. Some of the values are missing, but you have the information that you need to complete the table. Practices a Religion Seeks Intensive Life-Prolonging Care Yes No Totals Yes 184 No 192 Totals 208 360 First, select answers from the dropdown menus to fill in the values for th 400 missing cells in the table. Next, select answers from the dropdown menus to fill in the values for ti 32 ng row and column marginals in the table, including the total number of cases. Finally, select a title for the table from the following options: Religious Practice By Whether One Seeks Life-Prolonging Care for Terminally Ill Patients O Requests for Life-Prolonging Care By Religious Practice for Terminally Ill Patients Percent Requests for Life-Prolonging Care By Religious Practice for Terminally Ill Patients Percent Religious Practice By Whether One Seeks Life-Prolonging Care for Terminally Ill Patients You have successfully constructed a bivariate table. In subsequent questions, you will use bivariate tables to determine whether there is a significant relationship between the variables.O The only requirement is that the population variances be equal. O It requires no assumptions about the shape of the population or sampling distribution. The only requirement is that the sampling distribution be normally distributed. It is the simplest hypothesis test for repeated measures. Before you compute the chi square, you need to put the data into a bivariate table. By convention, the variable is placed in the rows. You find that 184 patients say that they do practice a religion and that they would seek intensive life-prolonging care; 8 say that they do practice a religion and that they would not seek intensive life-prolonging care; 176 say that they do not practice a religion and that they would seek intensive life-prolonging care; and finally 32 say that they do not practice a religion and that they would not seek intensive life-prolonging care. The following table shows some of the results of the study. Some of the values are missing, but you have the information that you need to complete the table. Practices a Religion Seeks Intensive Life-Prolonging Care Yes No Totals Yes 184 No 40 Totals 208 8 First, select answers from the dropdown menus 184 the values for the three missing cells in the table. Next, select answers from the dropdown menus 400 the values for the missing row and column marginals in the table, including the total number of cases. 176 Finally, select a title for the table from the following options: Religious Practice By Whether One Seeks Life-Prolonging Care for Terminally Ill Patients O Requests for Life-Prolonging Care By Religious Practice for Terminally Ill Patients Percent Requests for Life-Prolonging Care By Religious Practice for Terminally Ill Patients Percent Religious Practice By Whether One Seeks Life-Prolonging Care for Terminally Ill Patients You have successfully constructed a bivariate table. In subsequent questions, you will use bivariate tables to determine whether there is a significant relationship between the variables.O The only requirement is that the population variances be equal. 0 It requires no assumptions about the shape of the population or sampling distribution. 0 The only requirement is that the sampling distribution be normally distributed. 0 It is the simplest hypothesis test for repeated measures. Before you compute the chi square, you need to put the data into a bivariate table. By convention, the V variable is placed in the rows. You nd that 134 patients say that they do practice a religion and that they would seek intensive life-prolonging care; 3 say that they do practice a religion and that they would not seek intensive lifepro longing care; 176 say that they do not practice a reli 'on and that they would seek intensive lifeprolonging care; and nally 32 say that they do not practice a religion and that they would not seek intensive lifeprolonging care. The following table shows some ofthe results of the study. Some of the values are missing, but you have the infonTIation that you need to complete the table. Practices a Religion Seeks Intensive LileProlonging Care Yes No Totals Yes 184 l _V No _v l 40 Totals _V _V First, seleot answers from the dropdown menus to ll in the -r the three missing cells in the table. Next, select answers from the dropdown menus to ll in the -r the missing row and column marginals in the table, including the total number of cases. Finally, select a title for the table From the following options: 0 Religious Practice By Whether One Seeks ler-Prolonging Care for TenTIinaIIy III Patients 0 Requests for LifeProlonging Care By Religious Practice for Terminally Ill Patients 0 Percent Requests for LifeProlonging Care By Religious Prad:ioe for Terminally Ill Patients 0 Percent Religious Practice By Whether One Seeks ler-Prolonging Care for TenTIinaIIy Ill Patients You have successfully constructed a bivariate table. In subsequent questions, you will use bivariate tables to deten'nine whether there is a signicant relationship between the variables. It requires no assumptions about the shape of the population or sampling distribution. The only requirement is that the sampling distribution be normally distributed. O It is the simplest hypothesis test for repeated measures. Before you compute the chi square, you need to put the data into a bivariate table. By convention, the variable is placed in the rows. You find that 184 patients say that they do practice a religion and that they would seek intensive life-prolonging care; 8 say that they do practice a religion and that they would not seek intensive life-prolonging care; 176 say that they do not practice a religion and that they would seek intensive life-prolonging care; and finally 32 say that they do not practice a religion and that they would not seek intensive life-prolonging care. The following table shows some of the results of the study. Some of the values are missing, but you have the information that you need to complete the table. Practices a Religion Seeks Intensive Life-Prolonging Care Yes No Totals Yes 184 No 40 Totals 208 First, select answers from the dropdown menus 192 the values for the three missing cells in the table. 32 Next, select answers from the dropdown menus the values for the missing row and column marginals in the table, including the total number of cases. 400 360 Finally, select a title for the table from the follow. ons: O Religious Practice By Whether One Seeks Life-Prolonging Care for Terminally Ill Patients O Requests for Life-Prolonging Care By Religious Practice for Terminally Ill Patients Percent Requests for Life-Prolonging Care By Religious Practice for Terminally Ill Patients Percent Religious Practice By Whether One Seeks Life-Prolonging Care for Terminally Ill Patients You have successfully constructed a bivariate table. In subsequent questions, you will use bivariate tables to determine whether there is a significant relationship between the variables.O The only requirement is that the population variances be equal. It requires no assumptions about the shape of the population or sampling distribution. The only requirement is that the sampling distribution be normally distributed. O It is the simplest hypothesis test for repeated measures. Before you compute the chi square, you need to put the data into a bivariate table. By convention, the variable is placed in the owS. You find that 184 patients say that they do practice a religion and that they would seek intensive life-prolonging care; 8 say that they do practice a religion and that they would not seek intensive life-prolonging care; 176 say that they do not practice a religion and that they would seek intensive life-prolonging care; and finally 32 say that they do not practice a religion and that they would not seek intensive life-prolonging care. The following table shows some of the results of the study. Some of the values are missing, but you have the information that you need to complete the table. Practices a Religion Seeks Intensive Life-Prolonging Care Yes No Totals Yes 184 No 40 Totals 208 400 First, select answers from the dropdown menus to fill in the values for the missing cells in the table. 176 Next, select answers from the dropdown menus to fill in the values for ti ng row and column marginals in the table, including the total number of cases. 184 8 Finally, select a title for the table from the following options: Religious Practice By Whether One Seeks Life-Prolonging Care for Terminally Ill Patients O Requests for Life-Prolonging Care By Religious Practice for Terminally Ill Patients Percent Requests for Life-Prolonging Care By Religious Practice for Terminally Ill Patients Percent Religious Practice By Whether One Seeks Life-Prolonging Care for Terminally Ill Patients You have successfully constructed a bivariate table. In subsequent questions, you will use bivariate tables to determine whether there is a significant elationship between the variables.O The only requirement is that the population variances be equal. 0 It requires no assumptions about the sh ape of the population or sampling distribution. '0' The only requirement is that the sampling distribution be normally distributed. '0' It is the simplest hypothesis test for repeated measures. Before you compute the chi square. you need to put the data into a bivariate table. By oonvention, the V variable is placed in the FONS. You nd that 134 patients say that they do practice a religion and that they would seek intensive life-prolonging care; El say that they do practice a religion and that they would not seek intensive lifeprolonging care: 176 say that they do not practice a religion and that they would seek intensive lifeprolonging care; and nally 32 say that they do not practice a religion and that they would not seek intensive lifeprolonging care. The following table shows some ofthe results of the study. Some of the values are missing, but you have the information that you need to complete the table. Practices 3 Reli ion Seeks Intensive LileProln-nging Care Yes No Totals Yes 184 _V _V No _V _v 40 Totals _7 208 _V First. select answers from the dropdown menus to ll in the values for the three missing cells in the table. Next, select answers from the dropdown menus to ll in the values for the missing row and column marginals in the table, including the total number of cases. inally, select a title for the table From the following options: 0' Religious Practice By Whether One Seeks ler-Prolonging Care For Terminally Ill Patients '0' Requests for Life-Prolonging Care By Religious Practice for Terminally Ill Patients 0 Percent Requests for IerProlonging Care By Religious Practice for Terminally Ill Patients 0 Percent Religious Practice By Whether Clne Seeks ler-Prolonging Care for Terminally Ill Patients You have successfully constructed a bivariate table. In subsequent questions, you will use bivariate tables to deten'nine whether there is a signicant relationship between the variables
Step by Step Solution
There are 3 Steps involved in it

Get step-by-step solutions from verified subject matter experts