

Question: please send me the answer 7 8 9 10 11 12 13 14 15 16 17 18 19 20 data Q Based on the boxplot

please send me the answer
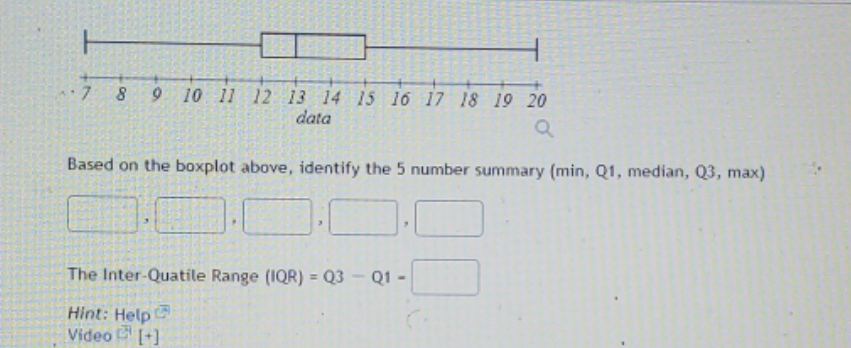
7 8 9 10 11 12 13 14 15 16 17 18 19 20 data Q Based on the boxplot above, identify the 5 number summary (min, Q1, median, Q3, max) The Inter-Quatile Range (IQR) = Q3 - Q1 - Hint: Help Video = [+]
Step by Step Solution
There are 3 Steps involved in it
1 Expert Approved Answer
Step: 1 Unlock

Question Has Been Solved by an Expert!
Get step-by-step solutions from verified subject matter experts
Step: 2 Unlock
Step: 3 Unlock