

Question: please send picture or typed code. Last answer was not right, it did not work in matlab. Figure 7 below shows one cycle of a
please send picture or typed code. Last answer was not right, it did not work in matlab.
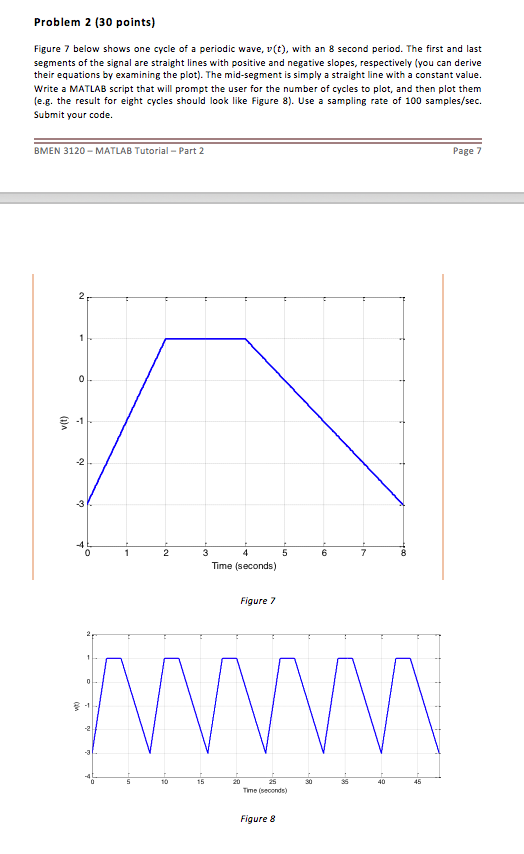
Figure 7 below shows one cycle of a periodic wave, v(t), with an 8 second period. The first and last segments of the signal are straight lines with positive and negative slopes, respectively (you can derive their equations by examining the plot). The mid-segment is simply a straight line with a constant value. Write a MATLAB script that will prompt the user for the number of cycles to plot, and then plot them (e.g. the result for eight cycles should look like Figure 8). Use a sampling rate of 100 samples/sec. Submit your code
Step by Step Solution
There are 3 Steps involved in it
1 Expert Approved Answer
Step: 1 Unlock

Question Has Been Solved by an Expert!
Get step-by-step solutions from verified subject matter experts
Step: 2 Unlock
Step: 3 Unlock