

Question: Please set up the X chart as well. Click the icon to view the ounces of caulking per tube data. More Info Click the icon
Please set up the X chart as well.
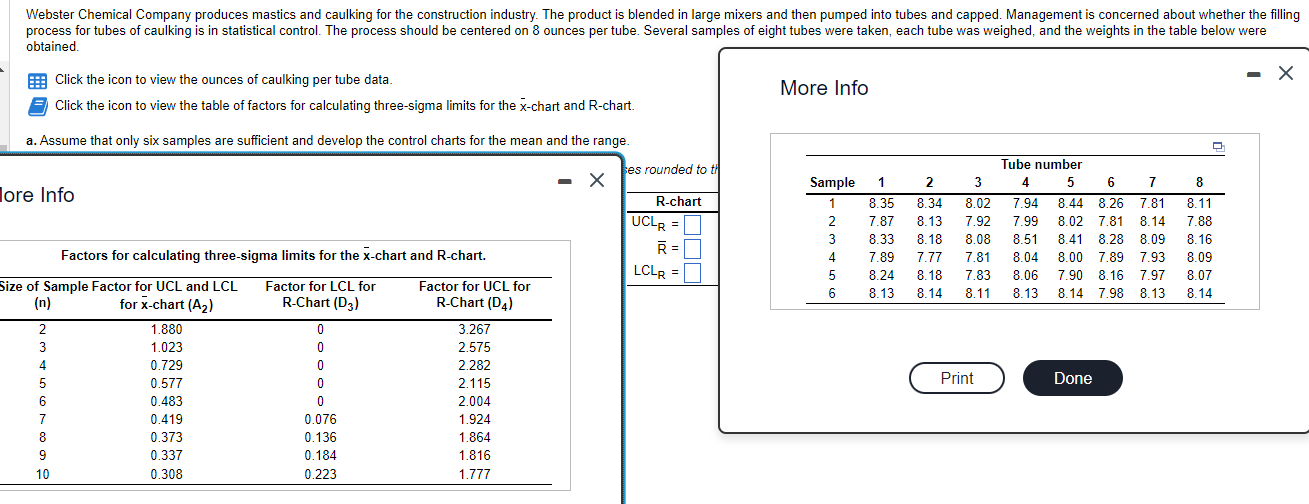
Click the icon to view the ounces of caulking per tube data. More Info Click the icon to view the table of factors for calculating three-sigma limits for the x-chart and R-chart. a. Assume that only six samples are sufficient and develop the control charts for the mean and the range. lore Info
Step by Step Solution
There are 3 Steps involved in it
1 Expert Approved Answer
Step: 1 Unlock

Question Has Been Solved by an Expert!
Get step-by-step solutions from verified subject matter experts
Step: 2 Unlock
Step: 3 Unlock