

Question: Please share each calculation and share the graphs so I can learn how to prepare this type of answer. A process fills cans with cola
Please share each calculation and share the graphs so I can learn how to prepare this type of answer.
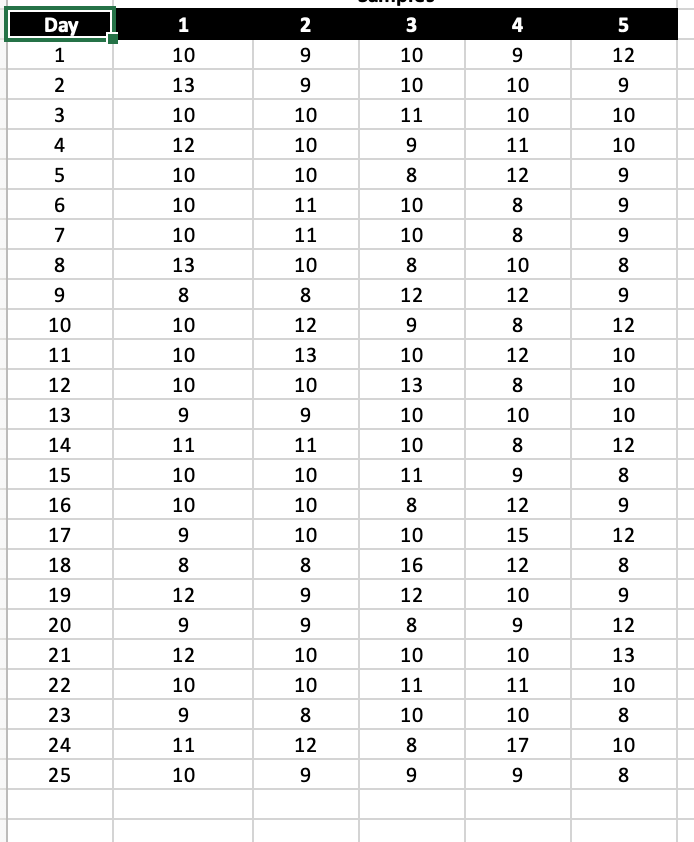
A process fills cans with cola and the cans must have the right amount of product before shipping to the wholesaler. Samples are taken over 25 days, and the amount of cola in ounces is measured. The aim is to achieve statistical control of the filling process using X and R-charts.
1
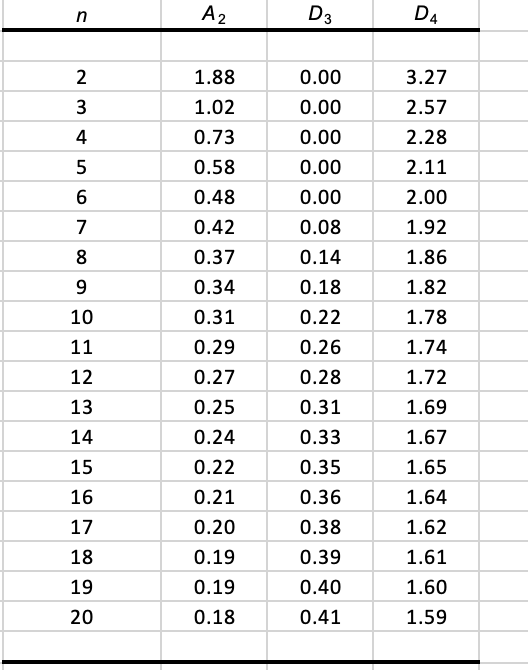
Prepare X and R-charts using these data with the standard 3-sigma control limit constants A2, D3, and D4 (see the Factors worksheet).
\begin{tabular}{|c|c|c|c|} \hlinen & A2 & D3 & D4 \\ \hline & & & \\ \hline 2 & 1.88 & 0.00 & 3.27 \\ \hline 3 & 1.02 & 0.00 & 2.57 \\ \hline 4 & 0.73 & 0.00 & 2.28 \\ \hline 5 & 0.58 & 0.00 & 2.11 \\ \hline 6 & 0.48 & 0.00 & 2.00 \\ \hline 7 & 0.42 & 0.08 & 1.92 \\ \hline 8 & 0.37 & 0.14 & 1.86 \\ \hline 9 & 0.34 & 0.18 & 1.82 \\ \hline 10 & 0.31 & 0.22 & 1.78 \\ \hline 11 & 0.29 & 0.26 & 1.74 \\ \hline 12 & 0.27 & 0.28 & 1.72 \\ \hline 13 & 0.25 & 0.31 & 1.69 \\ \hline 14 & 0.24 & 0.33 & 1.67 \\ \hline 15 & 0.22 & 0.35 & 1.65 \\ \hline 16 & 0.21 & 0.36 & 1.64 \\ \hline 17 & 0.20 & 0.38 & 1.62 \\ \hline 18 & 0.19 & 0.39 & 1.61 \\ \hline 19 & 0.19 & 0.40 & 1.60 \\ \hline 20 & 0.18 & 0.41 & 1.59 \\ \hline & & & \\ \hline \end{tabular}
Step by Step Solution
There are 3 Steps involved in it

Get step-by-step solutions from verified subject matter experts