

Question: Please share formula with numbers and cell reference (example: b4-b15) to help me understand. thank you A B C Jun. 30, 2016 Jun 30, 2015
Please share formula with numbers and cell reference (example: b4-b15) to help me understand. thank you
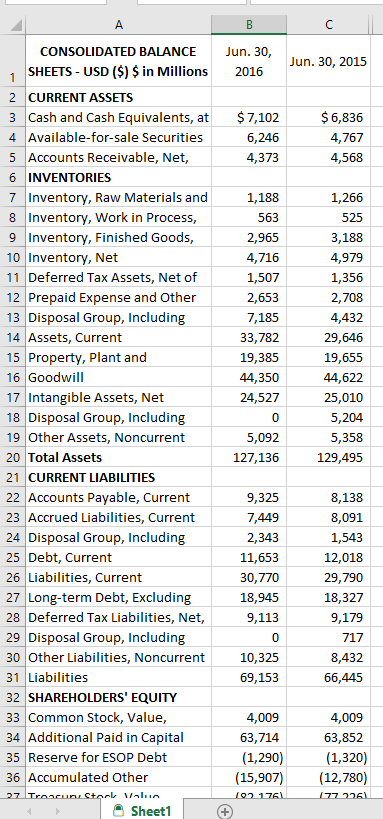
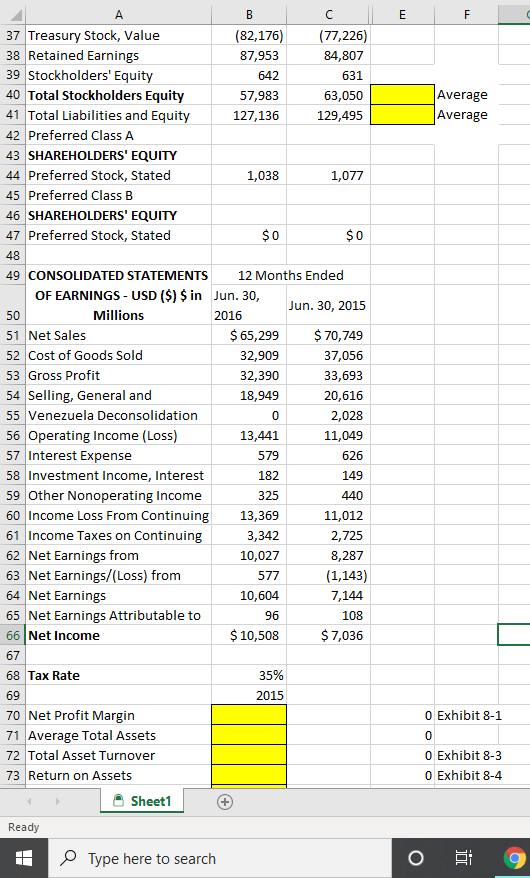
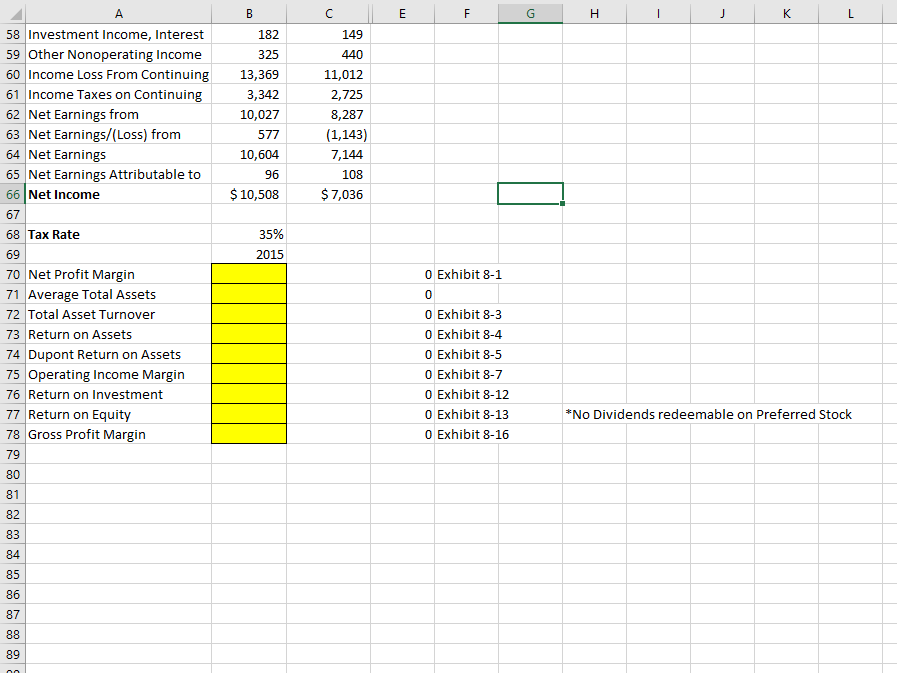
A B C Jun. 30, 2016 Jun 30, 2015 1 $ 7,102 6,246 4,373 $6,836 4,767 4,568 CONSOLIDATED BALANCE SHEETS- USD ($) $ in Millions 2 CURRENT ASSETS 3 Cash and Cash Equivalents, at 4 Available-for-sale Securities 5 Accounts Receivable, Net, 6 INVENTORIES 7 Inventory, Raw Materials and 8 Inventory, Work in Process, 9 Inventory, Finished Goods, 10 Inventory, Net 11 Deferred Tax Assets, Net of 12 Prepaid Expense and Other 13 Disposal Group, Including 14 Assets, Current 15 Property, Plant and 16 Goodwill 17 Intangible Assets, Net 18 Disposal Group, Including 19 Other Assets, Noncurrent 20 Total Assets 21 CURRENT LIABILITIES 22 Accounts Payable, Current 23 Accrued Liabilities, Current 24 Disposal Group, Including 25 Debt, Current 26 Liabilities, Current 27 Long-term Debt, Excluding 28 Deferred Tax Liabilities, Net, 29 Disposal Group, Including 30 Other Liabilities, Noncurrent 31 Liabilities 32 SHAREHOLDERS' EQUITY 33 Common Stock, Value, 34 Additional Paid in Capital 35 Reserve for ESOP Debt 36 Accumulated Other 27 Troacun Starl Value Sheet1 1,188 563 2,965 4,716 1,507 2,653 7,185 33,782 19,385 44,350 24,527 0 5,092 127,136 1,266 525 3,188 4,979 1,356 2,708 4,432 29,646 19,655 44,622 25,010 5,204 5,358 129,495 9,325 7,449 2,343 11,653 30,770 18,945 9,113 0 10,325 69,153 8,138 8,091 1,543 12,018 29,790 18,327 9,179 717 8,432 66,445 4,009 63,714 (1,290) (15,907) 4,009 63,852 (1,320) (12,780) 102 1761 177 2261 + B E F Average Average 37 Treasury Stock, Value (82,176) (77,226) 38 Retained Earnings 87,953 84,807 39 Stockholders' Equity 642 631 40 Total Stockholders Equity 57,983 63,050 41 Total Liabilities and Equity 127,136 129,495 42 Preferred Class A 43 SHAREHOLDERS' EQUITY 44 Preferred Stock, Stated 1,038 1,077 45 Preferred Class B 46 SHAREHOLDERS' EQUITY 47 Preferred Stock, Stated $0 $0 48 49 CONSOLIDATED STATEMENTS 12 Months Ended OF EARNINGS- USD ($) $ in Jun. 30, Jun. 30, 2015 50 Millions 2016 51 Net Sales $ 65,299 $ 70,749 52 Cost of Goods Sold 32,909 37,056 53 Gross Profit 32,390 33,693 54 Selling, General and 18,949 20,616 55 Venezuela Deconsolidation 0 2,028 56 Operating Income (Loss) 13,441 11,049 57 Interest Expense 579 626 58 Investment Income, Interest 182 149 59 Other Nonoperating Income 325 440 60 Income Loss From Continuing 13,369 11,012 61 Income Taxes on Continuing 3,342 2,725 62 Net Earnings from 10,027 8,287 63 Net Earnings/(Loss) from 577 (1,143) 64 Net Earnings 10,604 7,144 65 Net Earnings Attributable to 96 108 66 Net Income $ 10,508 $ 7,036 67 68 Tax Rate 35% 69 2015 70 Net Profit Margin 71 Average Total Assets 72 Total Asset Turnover 73 Return on Assets Sheet1 0 Exhibit 8-1 0 O Exhibit 8-3 0 Exhibit 8-4 Ready Type here to search B E F G I J K L 182 149 325 440 13,369 3,342 10,027 577 10,604 96 $ 10,508 11,012 2,725 8,287 (1,143) 7,144 108 $7,036 58 Investment Income, Interest 59 Other Nonoperating Income 60 Income Loss From Continuing 61 Income Taxes on Continuing 62 Net Earnings from 63 Net Earnings/(Loss) from 64 Net Earnings 65 Net Earnings Attributable to 66 Net Income 67 68 Tax Rate 69 70 Net Profit Margin 71 Average Total Assets 72 Total Asset Turnover 73 Return on Assets 74 Dupont Return on Assets 75 Operating Income Margin 76 Return on Investment 77 Return on Equity 78 Gross Profit Margin 79 35% 2015 O Exhibit 8-1 0 O Exhibit 8-3 o Exhibit 8-4 O Exhibit 8-5 O Exhibit 8-7 O Exhibit 8-12 O Exhibit 8-13 O Exhibit 8-16 *No Dividends redeemable on Preferred Stock 80 81 82 83 84 85 86 87 88 89
Step by Step Solution
There are 3 Steps involved in it

Get step-by-step solutions from verified subject matter experts