

Question: Please show all formulas and calculations and interpret meaning! Using the data provided, calculate and interpret the degree of combined leverage (DCL) for Disney and
Please show all formulas and calculations and interpret meaning!
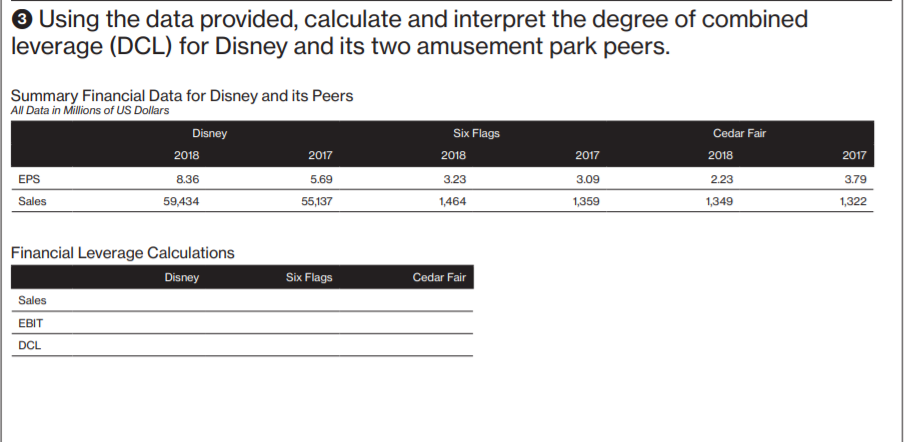
Using the data provided, calculate and interpret the degree of combined leverage (DCL) for Disney and its two amusement park peers. Summary Financial Data for Disney and its Peers All Data in Millions of US Dollars Disney 2018 2017 EPS 8.36 Sales 59,434 55,137 Six Flags 2018 Cedar Fair 2018 2017 5.69 3.23 3.09 2.23 2017 3.79 1,322 1,464 1,359 1,349 Six Flags Cedar Fair Financial Leverage Calculations Disney Sales EBIT DCL Using the data provided, calculate and interpret the degree of combined leverage (DCL) for Disney and its two amusement park peers. Summary Financial Data for Disney and its Peers All Data in Millions of US Dollars Disney 2018 2017 EPS 8.36 Sales 59,434 55,137 Six Flags 2018 Cedar Fair 2018 2017 5.69 3.23 3.09 2.23 2017 3.79 1,322 1,464 1,359 1,349 Six Flags Cedar Fair Financial Leverage Calculations Disney Sales EBIT DCL
Step by Step Solution
There are 3 Steps involved in it

Get step-by-step solutions from verified subject matter experts