

Question: Please show all formulas You work as an economic analyst for an investment firm. You believe there are four possible states for the economy over
Please show all formulas
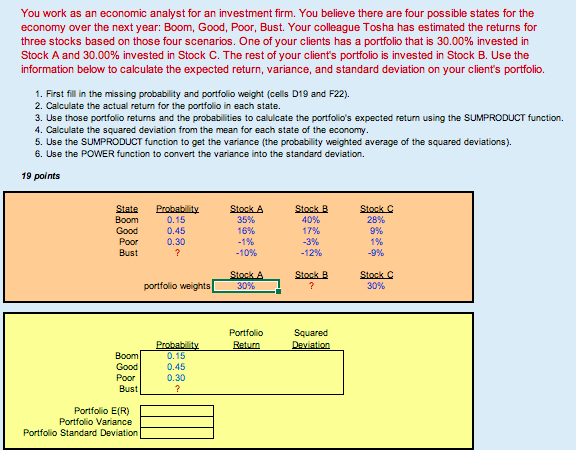
You work as an economic analyst for an investment firm. You believe there are four possible states for the economy over the next year: Boom, Good, Poor, Bust. Your colleague Tosha has estimated the returns for three stocks based on those four scenarios. One of your clients has a portfolio that is 30.00% invested in Stock A and 30.00% invested in Stock C. The rest of your client's portfolio is invested in Stock B. Use the information below to calculate the expected return, variance, and standard deviation on your client's portfolio. 1. First fill in the missing probability and portfolio weight (cells D19 and F22). 2. Calculate the actual return for the portfolio in each state. 3. Use those portfolio returns and the probabilities to calulcate the portfolio's expected return using the SUMPRODUCT function. 4. Calculate the squared deviation from the mean for each state of the economy. 5. Use the SUMPRODUCT function to get the variance (the probability weighted average of the squared deviations). 6. Use the POWER function to convert the variance into the standard deviation. 19 points State Stock A Stock B Stock C Probability 0.15 Boom 35% 40% 28% Good 0.45 16% 17% 9% Poor 0.30 -1% -3% 1% Bust ? -10% -12% -9% Stock A Stock C Stock B ? portfolio weights 30% 30% Portfolio Squared Probability Return Deviation 0.15 0.45 0.30 ? Boom Good Poor Bust Portfolio E(R) Portfolio Variance Portfolio Standard Deviation
Step by Step Solution
There are 3 Steps involved in it

Get step-by-step solutions from verified subject matter experts