

Question: Please show all of your work for the problems below to receive partial and full credit. 1. A) Using the limit denition of the derivative,
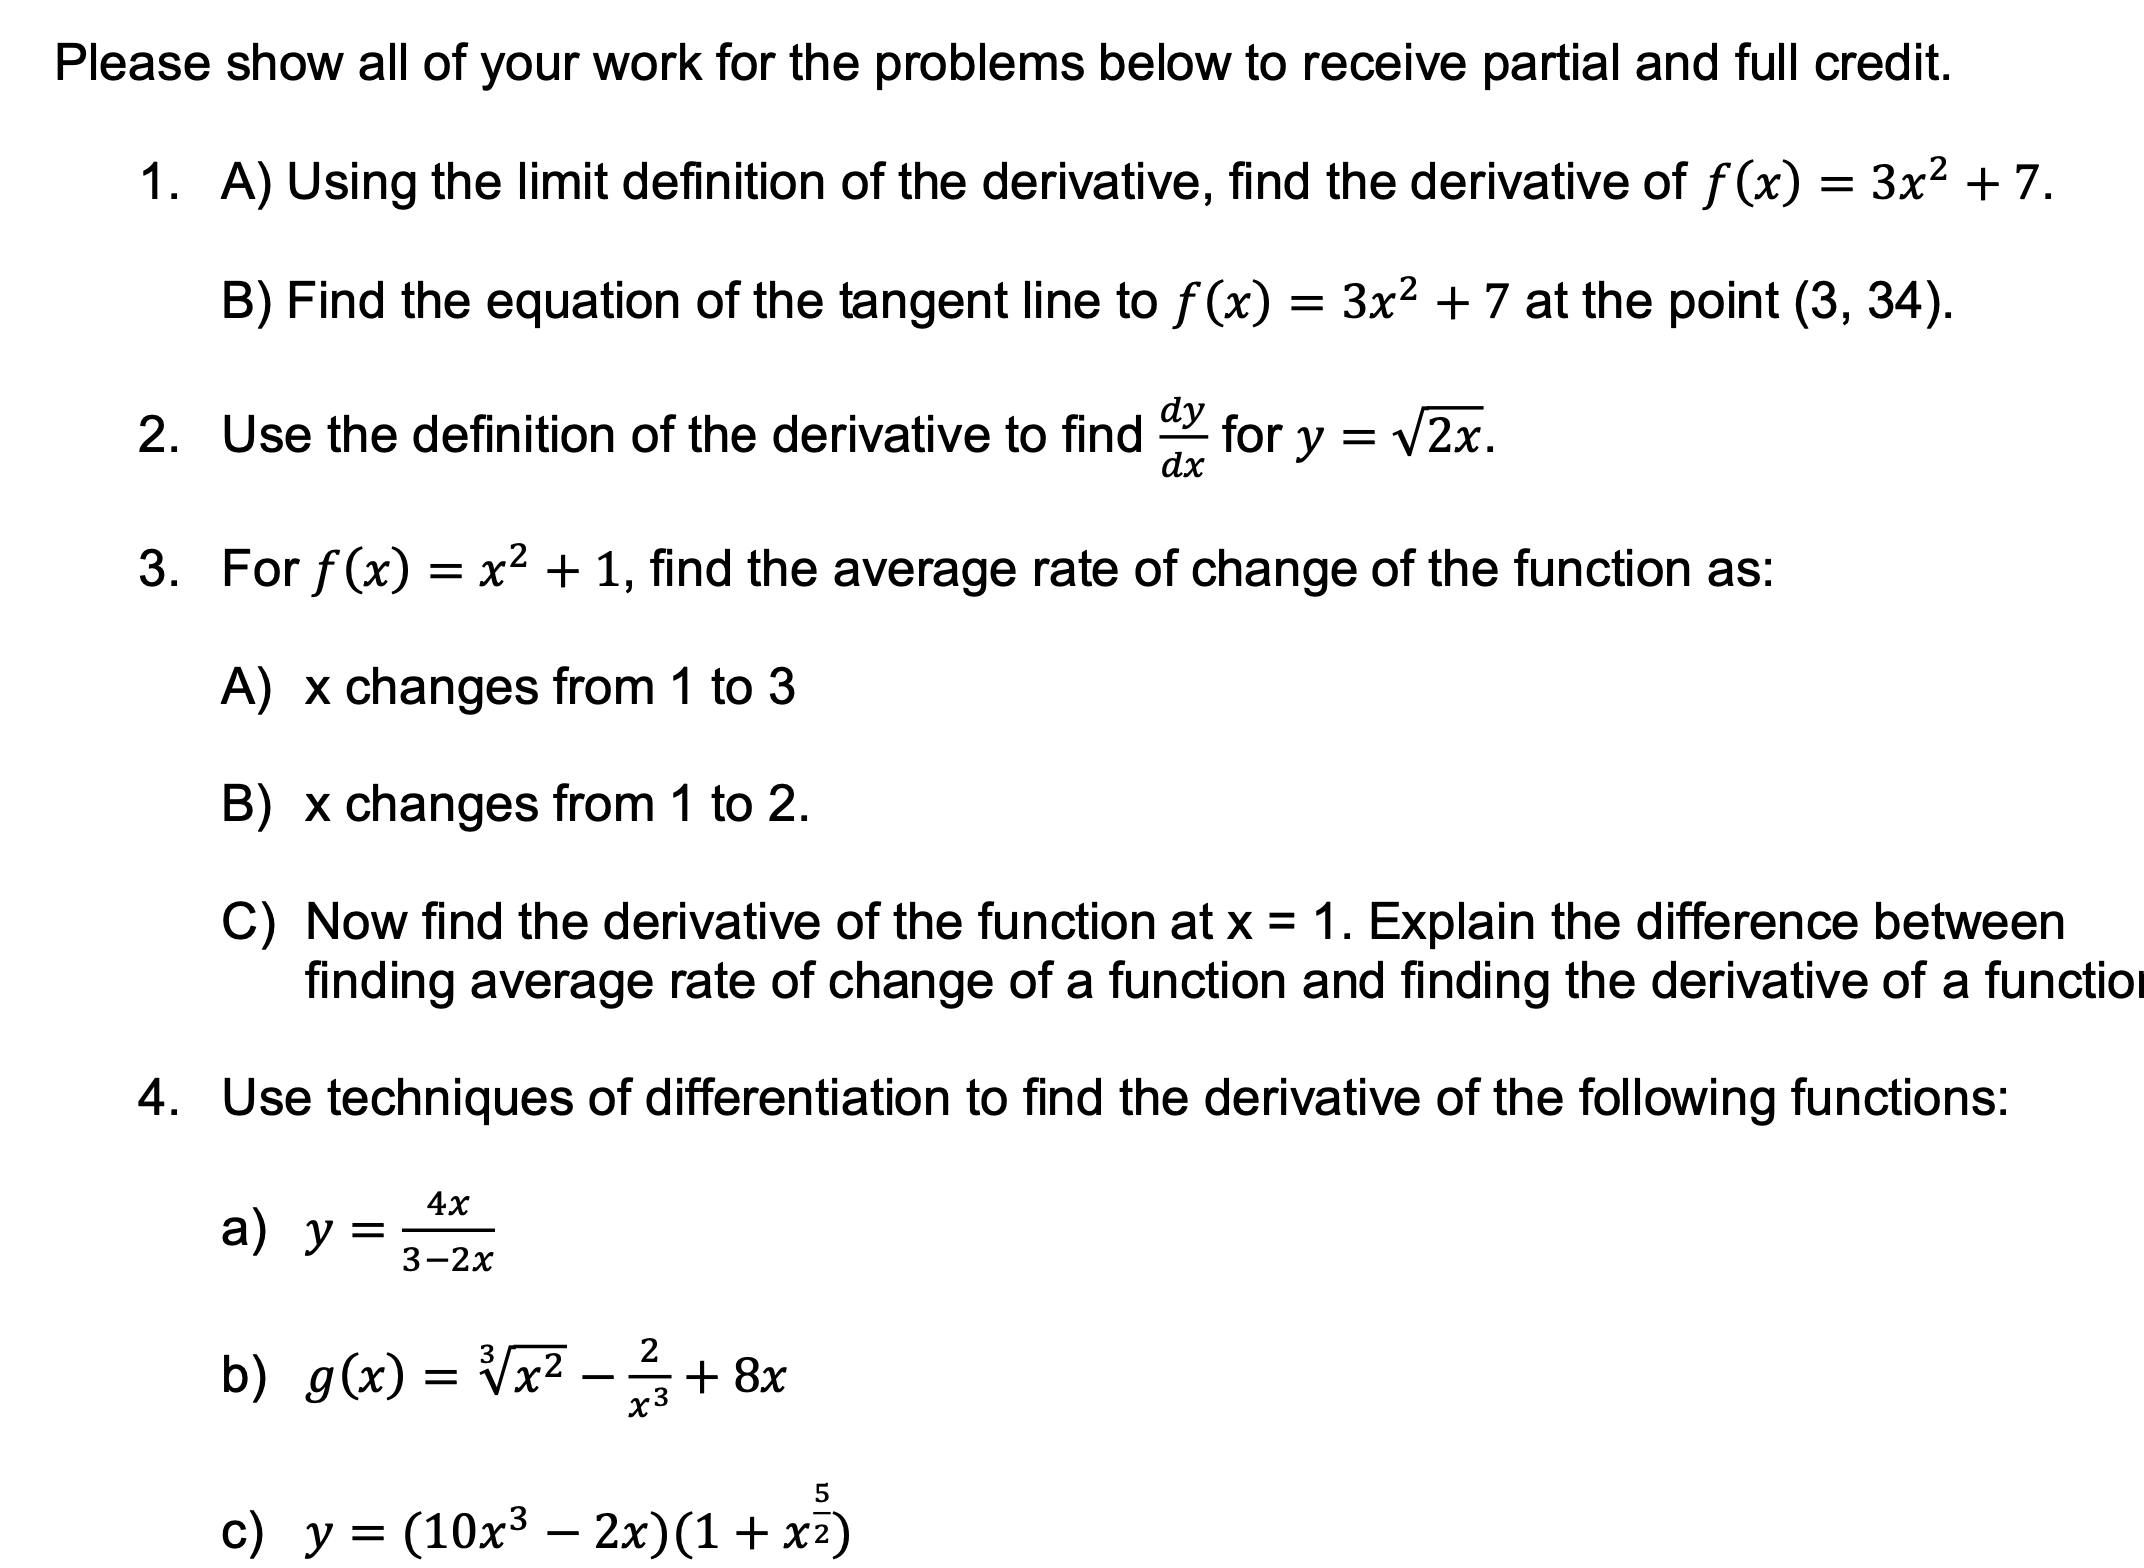
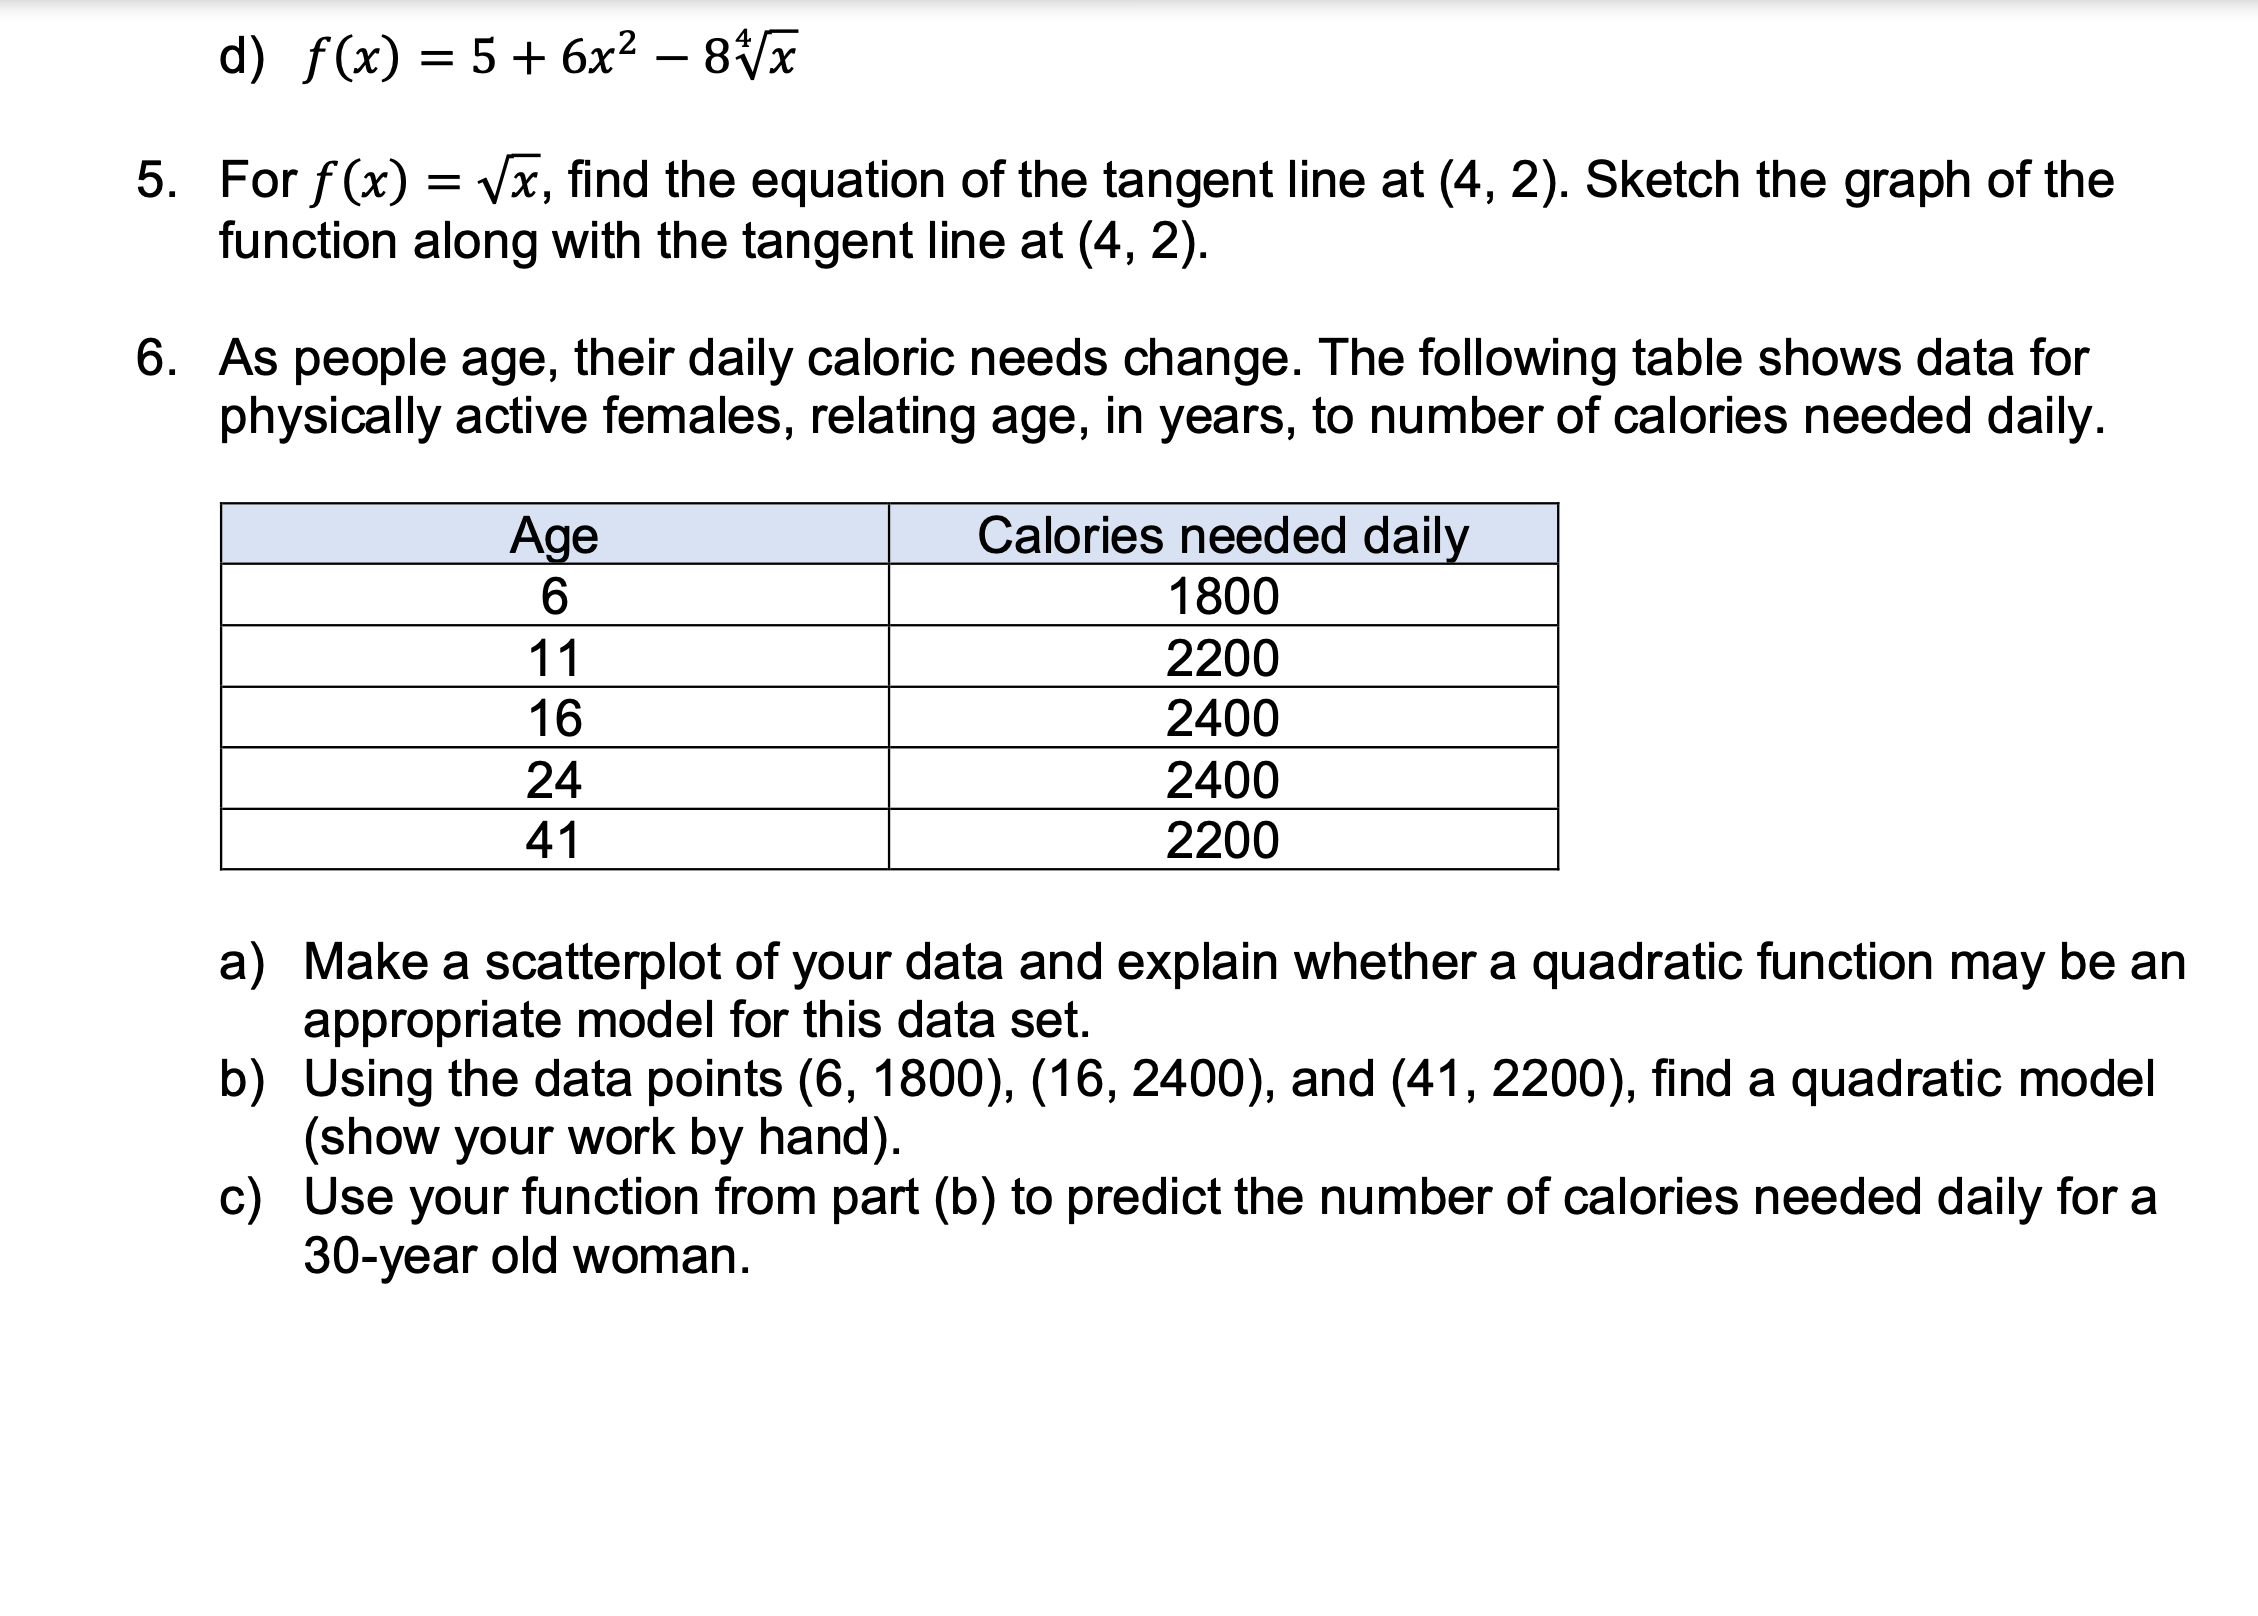

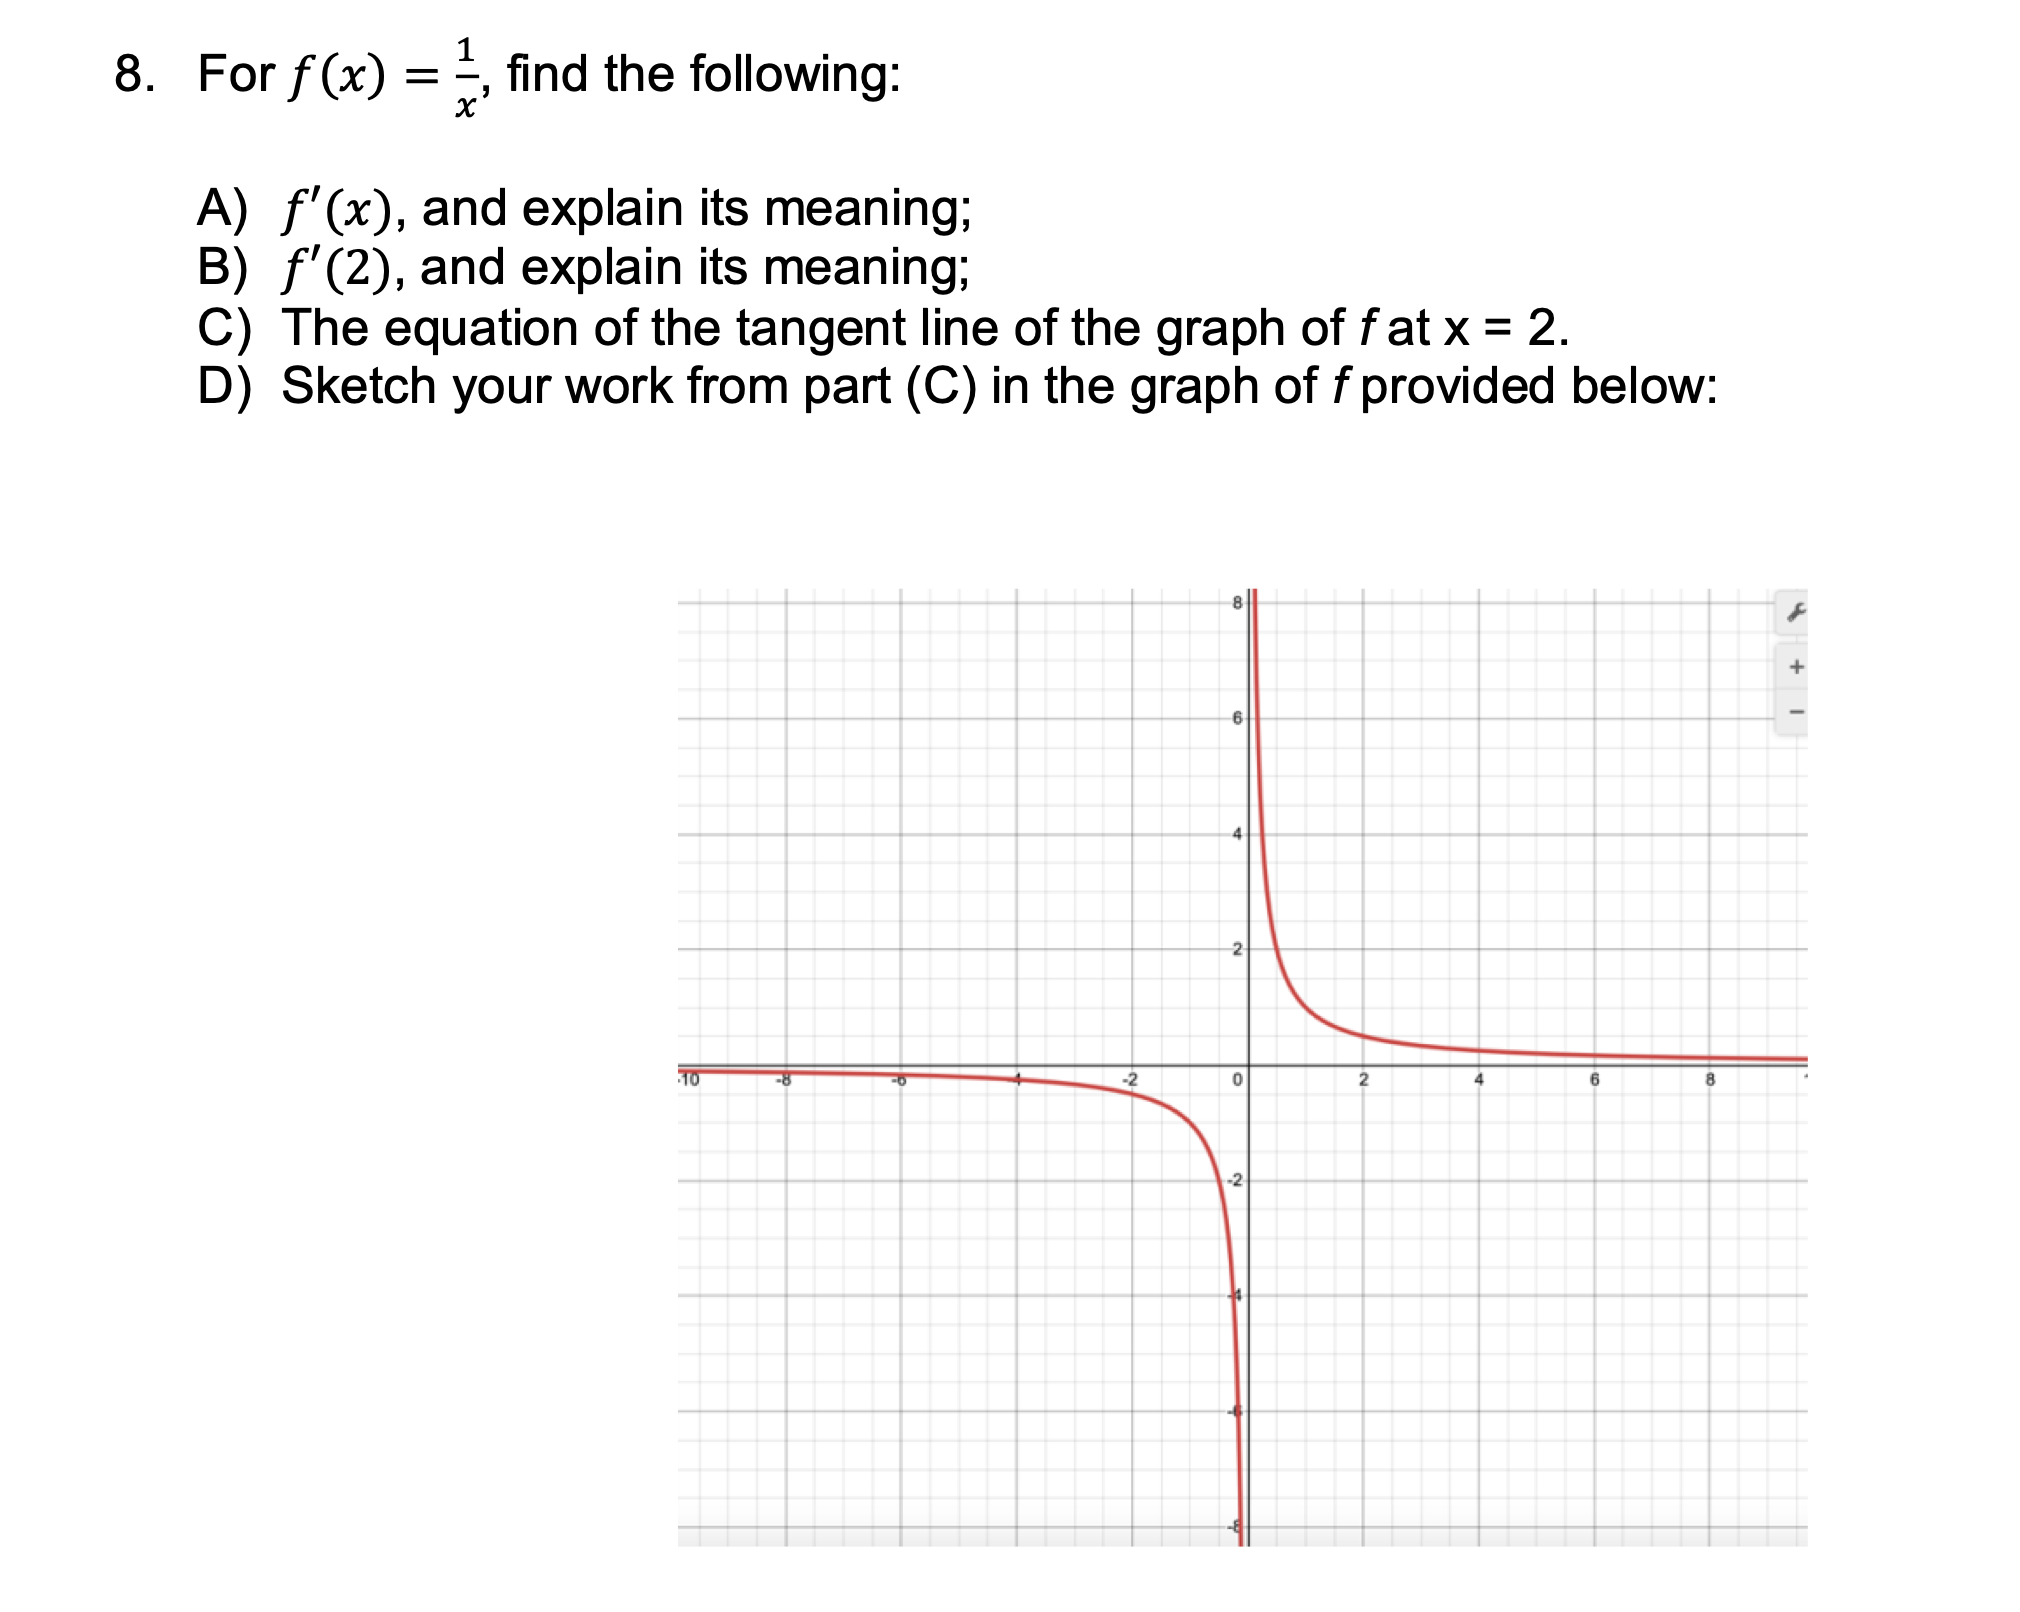


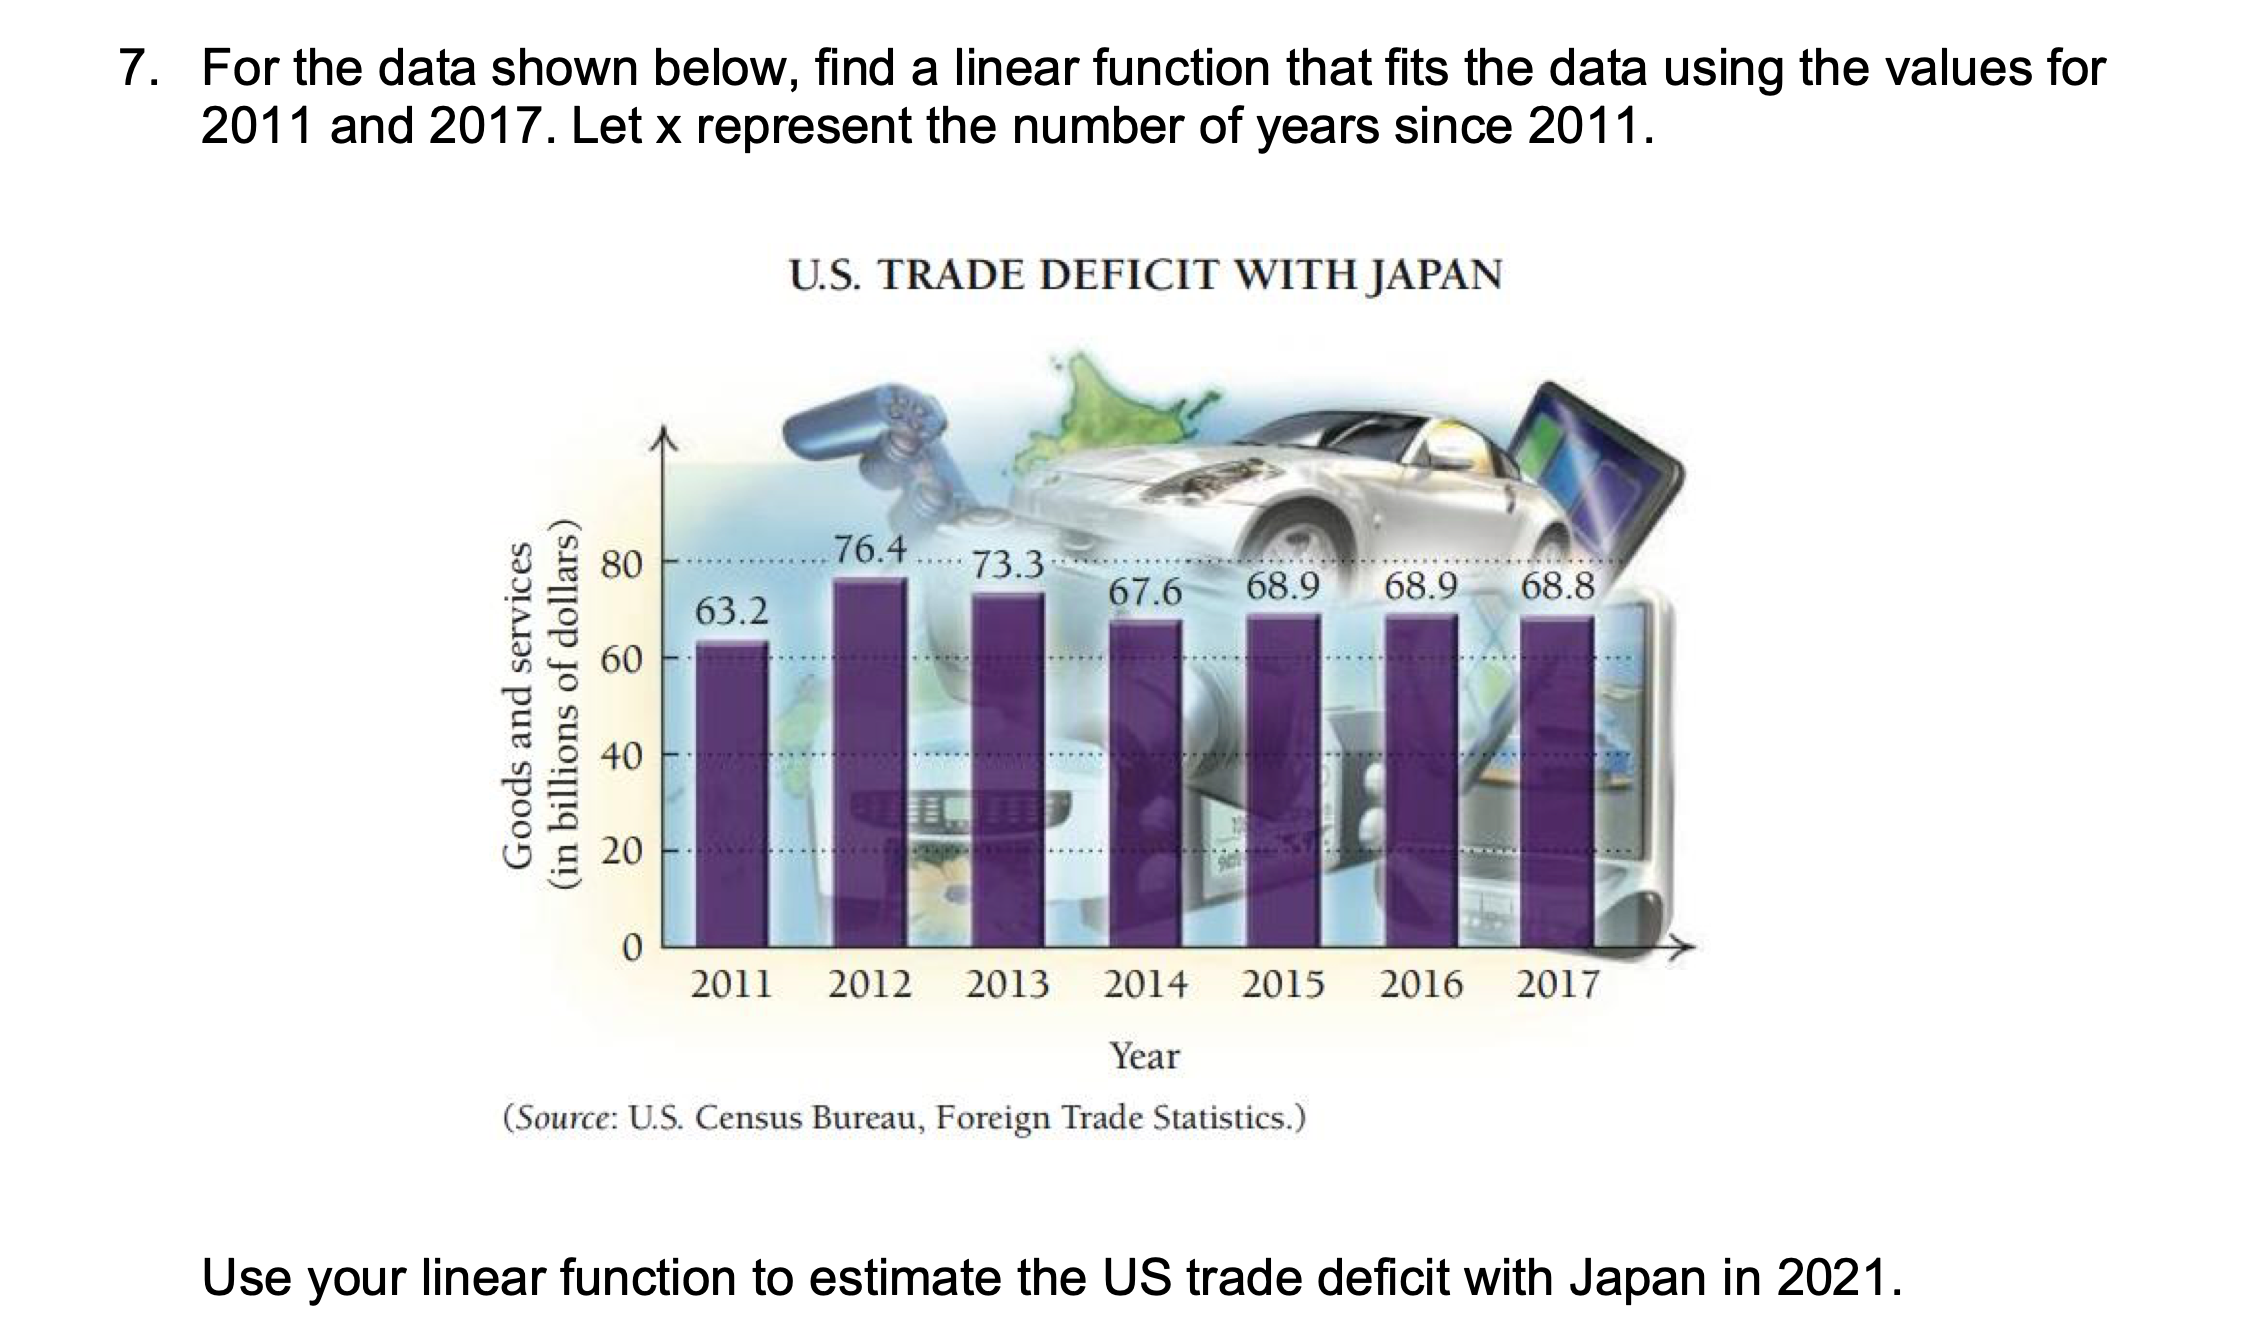

Please show all of your work for the problems below to receive partial and full credit. 1. A) Using the limit denition of the derivative, find the derivative of f (x) = 3x2 + 7. B) Find the equation of the tangent line to f(x) = 3x2 + 7 at the point (3, 34). 2. Use the definition of the derivative to find 2% for y = m. 3. For f (x) = x2 + 1, find the average rate of change of the function as: A) x changes from 1 to 3 B) x changes from 1 to 2. C) Now find the derivative of the function at x = 1. Explain the difference between finding average rate of change of a function and finding the derivative of a functior 4. Use techniques of differentiation to find the derivative of the following functions: 4x a) y=32x b) g(x) = W%+8x c) y = (109:3 2x)(1 + x3) d) f(x) = 5+6x28W 5. For f (x) = J97, find the equation of the tangent line at (4, 2). Sketch the graph of the function along with the tangent line at (4, 2). 6. As people age, their daily caloric needs change. The following table shows data for physically active females, relating age, in years, to number of calories needed daily. Calories needed dail __ 1800 2200 2400 2400 2200 a) Make a scatterplot of your data and explain whether a quadratic function may be an appropriate model for this data set. b) Using the data points (6, 1800), (16, 2400), and (41, 2200), find a quadratic model (show your work by hand). c) Use your function from part (b) to predict the number of calories needed daily for a 30-year old woman. 7. For the data shown below, find a linear function that fits the data using the values for 2011 and 2017. Let x represent the number of years since 2011. U.S. TRADE DEFICIT WITH JAPAN 80 76.4 ..... 73.3 68.9 68.9 68.8 63.2 67.6 60 .. . . .... -. .. .. Goods and services (in billions of dollars) 40 . . . . . . ..... 20 ... 0 2011 2012 2013 2014 2015 2016 2017 Year (Source: U.S. Census Bureau, Foreign Trade Statistics.) Use your linear function to estimate the US trade deficit with Japan in 2021.8. For f(x) = i, nd the following: A) f'(x), and explain its meaning; B) f'(2), and explain its meaning; C) The equation of the tangent line of the graph of fat x = 2. D) Sketch your work from part (C) in the graph of f provided below
Step by Step Solution
There are 3 Steps involved in it

Get step-by-step solutions from verified subject matter experts