

Question: Please show all steps for the hypothesis testing; use either the critical value approach or the p-value approach. Using the quantitative variable AGE, 3) Find
Please show all steps for the hypothesis testing; use either the critical value approach or the p-value approach.
Using the quantitative variable AGE,
3) Find a 95% confidence interval for the population mean GPA score for all MCCC students. Interpret your results.
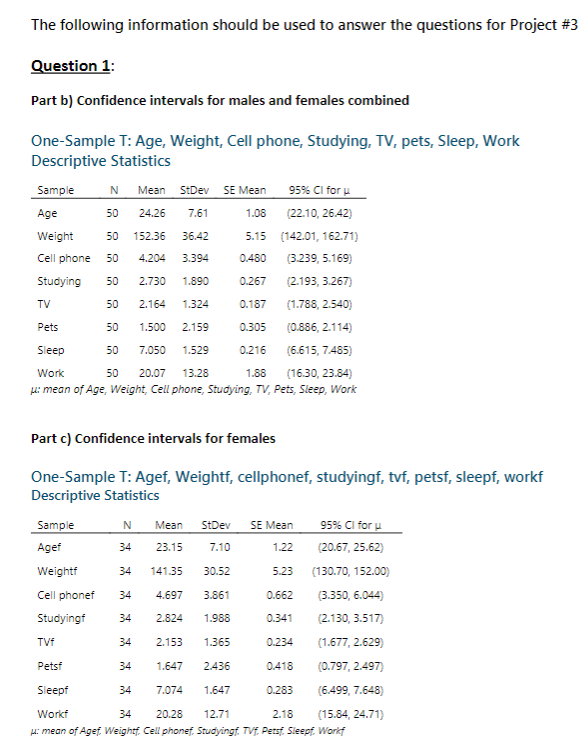
The following information should be used to answer the questions for Project #3 Question 1: Part b) Confidence intervals for males and females combined One-Sample T: Age, Weight, Cell phone, Studying, TV, pets, Sleep, Work Descriptive Statistics Sample N Mean StDev SE Mean 95% CI for Age 50 24.26 7.61 1.08 (22.10.26.42) Weight 50 152.36 36.42 5.15 (142.01, 162.71) Cell phone 50 4.204 3.394 0.480 3.239, 5.169) Studying 50 2.730 1.890 0.267 (2.193, 3.267) TV 50 2.164 1.324 0.187 (1.788, 2.540) Pets 50 1.500 2.159 0.305 (0.886, 2.114) Sleep 50 7.050 1.529 0.216 (6.615, 7.485) Work 50 20.07 13.28 1.88 (16.30, 23.84 l: mean of Age Weight, cell phone, Studying, TV, Pets, Sleep, Work Part c) Confidence intervals for females One-Sample T: Agef, Weightf, cellphonef, studyingf, tvf, petsf, sleepf, workf Descriptive Statistics Sample N Mean StDev SE Mean 95% CI for Ager 34 23.15 7.10 1.22 (20.67, 25.62) Weight 34 141.35 30.52 5.23 (130.70, 152.00) Cell phonef 34 4.697 3.861 0.662 3.350, 6.044 Studying 34 2.824 1.988 0.341 (2.130, 3.517) TV 34 2.153 1.365 0.234 (1.677, 2.629) Petsf 34 1.647 2.436 0.418 (0.797, 2.497) Sleepf 34 7.074 1.647 0.283 (6.499, 7.648) Workf 34 20.28 12.71 2.18 (15.84.24.71) mean of Agef. Weight Cell phonef Studyingf. TV. Petst. Sleepf. Works
Step by Step Solution
There are 3 Steps involved in it
1 Expert Approved Answer
Step: 1 Unlock

Question Has Been Solved by an Expert!
Get step-by-step solutions from verified subject matter experts
Step: 2 Unlock
Step: 3 Unlock