

Question: Please show all steps on EXCEL 1) Data Tables Review the worksheet labeled 6-Data Tables (This is the same worksheet we worked on in class
Please show all steps on EXCEL 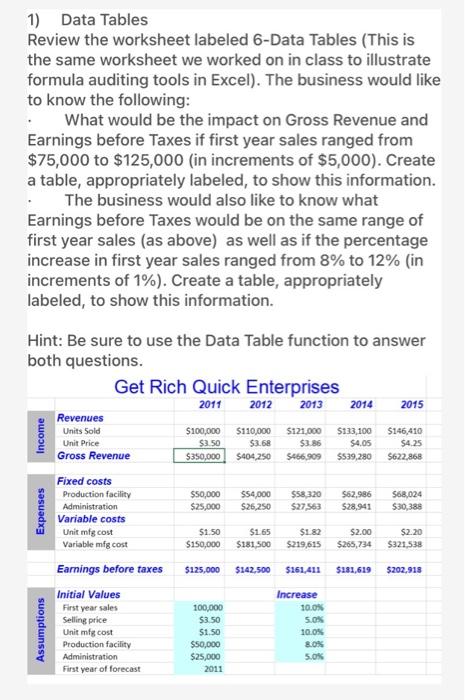
1) Data Tables Review the worksheet labeled 6-Data Tables (This is the same worksheet we worked on in class to illustrate formula auditing tools in Excel). The business would like to know the following: . What would be the impact on Gross Revenue and Earnings before Taxes if first year sales ranged from $75,000 to $125,000 (in increments of $5,000). Create a table, appropriately labeled, to show this information. . The business would also like to know what Earnings before Taxes would be on the same range of first year sales (as above) as well as if the percentage increase in first year sales ranged from 8% to 12% (in increments of 1%). Create a table, appropriately labeled, to show this information. Hint: Be sure to use the Data Table function to answer both questions. Get Rich Quick Enterprises 2011 2012 2013 2014 2015 Revenues Units Sold $100,000 $110,000 $121.000 $133,100 $146,410 Unit Price $3.50 $3.68 $3.86 $4.05 $4.25 Gross Revenue $350,000 $404,250 5466,909 $539,280 $622,868 Fixed costs Production facility $50,000 $54,000 $58,320 $62,986 $68,024 Administration $25,000 $26,250 $27,553 $28,941 $30,388 Variable costs Unit mfg cost $1.50 $1.65 $1.82 $2.00 $2.20 Variable mfg cost $150,000 $181.500 $219,615 $265,734 $321,538 Earnings before taxes $125,000 $142.500 $161,411 $181,619 $202,918 Income Expenses Assumptions Initial Values First year sales Selling price Unit mfg cost Production facility Administration First year of forecast 100,000 $3.50 $1.50 $50,000 $25,000 2011 Increase 10.08 5.0% 10.0% 8.ON 5.0%
Step by Step Solution
There are 3 Steps involved in it
1 Expert Approved Answer
Step: 1 Unlock

Question Has Been Solved by an Expert!
Get step-by-step solutions from verified subject matter experts
Step: 2 Unlock
Step: 3 Unlock