

Question: Please show all the work so I know how to do it. This is for my statistics class. 4) The boxplot and descriptive statistics below
Please show all the work so I know how to do it. This is for my statistics class.
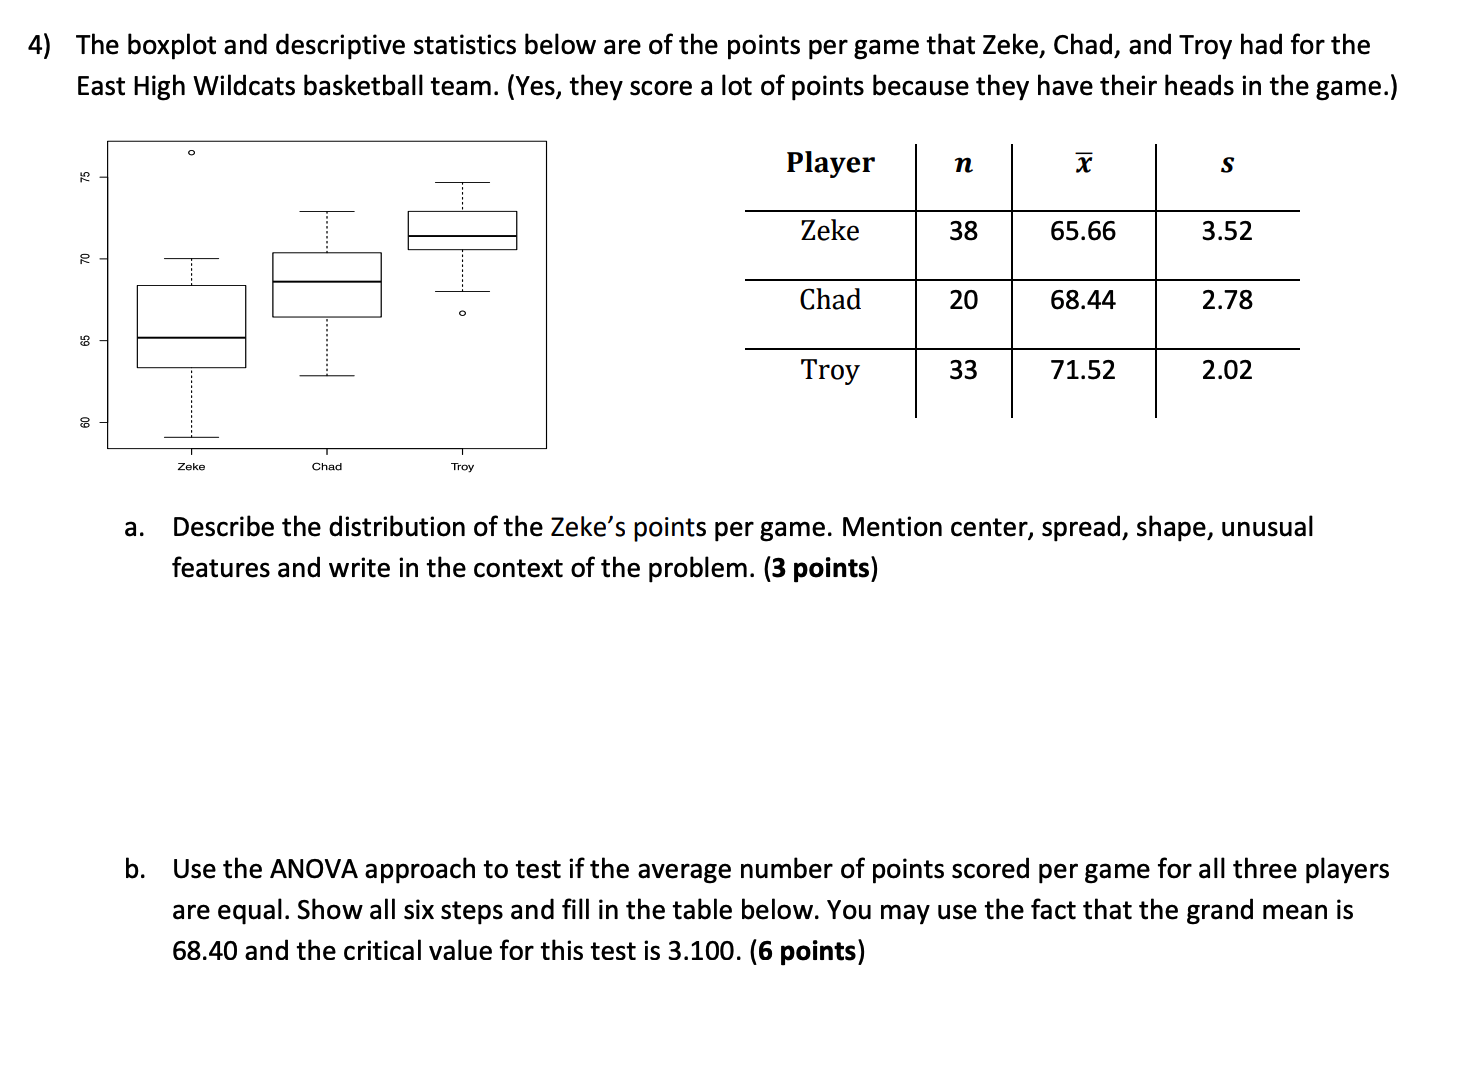
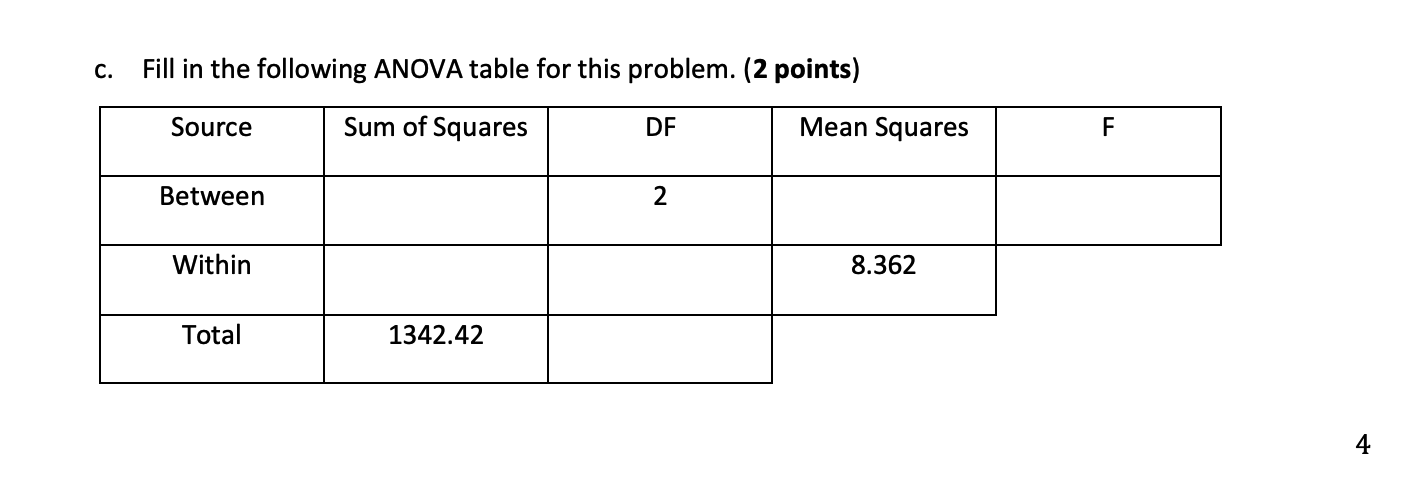
4) The boxplot and descriptive statistics below are of the points per game that Zeke, Chad, and Troy had for the East High Wildcats basketball team. (Yes, they Score a lot of points because they have their heads in the game.) a. Describe the distribution of the Zeke's points per game. Mention center, spread, shape, unusual features and write in the context of the problem. (3 points) b. Use the ANOVA approach to test if the average number of points scored per game for all three players are equal. Show all six steps and ll in the table below. You may use the fact that the grand mean is 68.40 and the critical value for this test is 3.100. {6 points) c. Fill in the following ANOVA table for this problem. (2 points) Source Sum of Squares DF Mean Squares F Between 2 Within 8.362 Total 1342.42 4
Step by Step Solution
There are 3 Steps involved in it

Get step-by-step solutions from verified subject matter experts