

Question: PLEASE SHOW ALL WORK!!! 2. (10 points) The data below (REAL data, not FAKE data) show that Joe Biden won the presidential election in the
PLEASE SHOW ALL WORK!!!
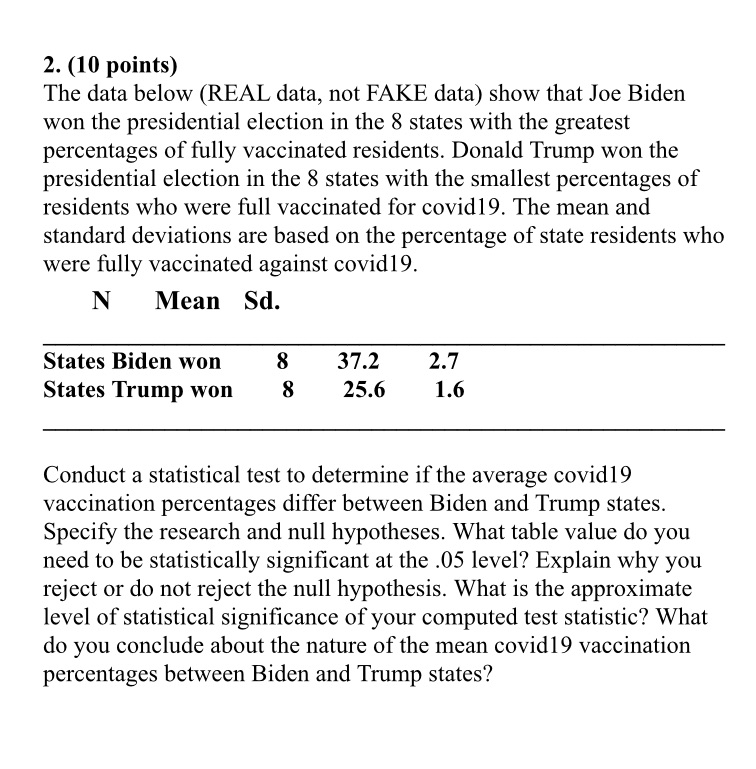
2. (10 points) The data below (REAL data, not FAKE data) show that Joe Biden won the presidential election in the 8 states with the greatest percentages of fully vaccinated residents. Donald Trump won the presidential election in the 3 states with the smallest percentages of residents who were lll vaccinated for covid19. The mean and standard deviations are based on the percentage of state residents who were fully vaccinated against covidl 9. N Mean Sd. States Biden won 8 37.2 2.? States Trump won 8 25.6 1.6 Conduct a statistical test to determine if the average covid19 vaccination percentages differ between Biden and Trump states. Specify the research and null hypotheses. What table value do you need to be statistically signicant at the .05 level? Explain why you reject or do not reject the null hypothesis. What is the approximate level of statistical signicance of your computed test statistic? What do you conclude about the nature of the mean covid19 vaccination percentages between Biden and Trump states
Step by Step Solution
There are 3 Steps involved in it

Get step-by-step solutions from verified subject matter experts