

Question: Please show all work, and do not use any software! Thank you! Please only answer g,h,i and j. Thank you Please let me know what

 Please show all work, and do not use any software! Thank you! Please only answer g,h,i and j. Thank you Please let me know what other info is needed.
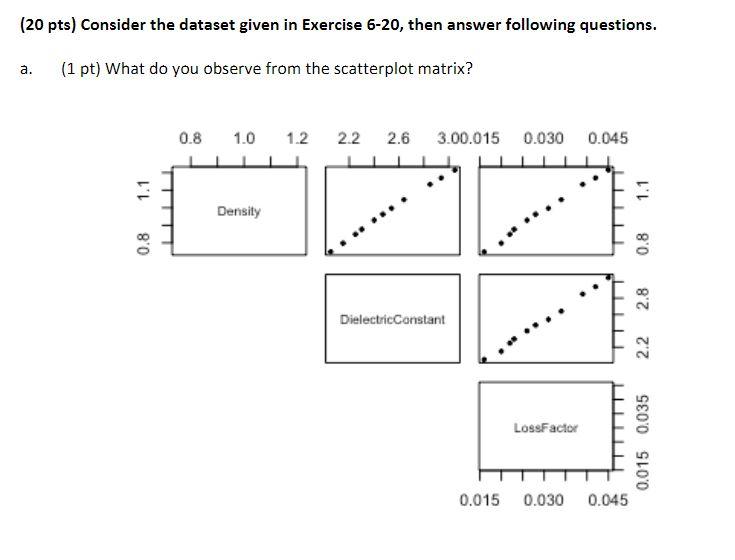
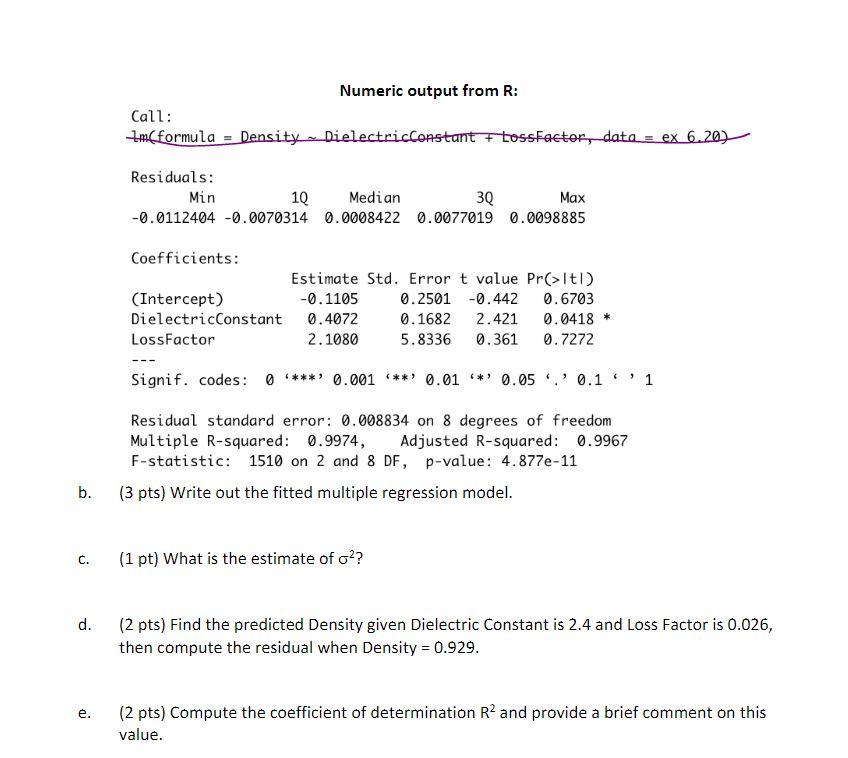
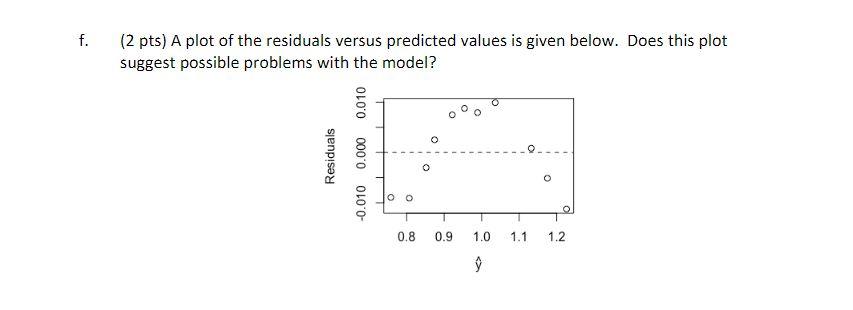
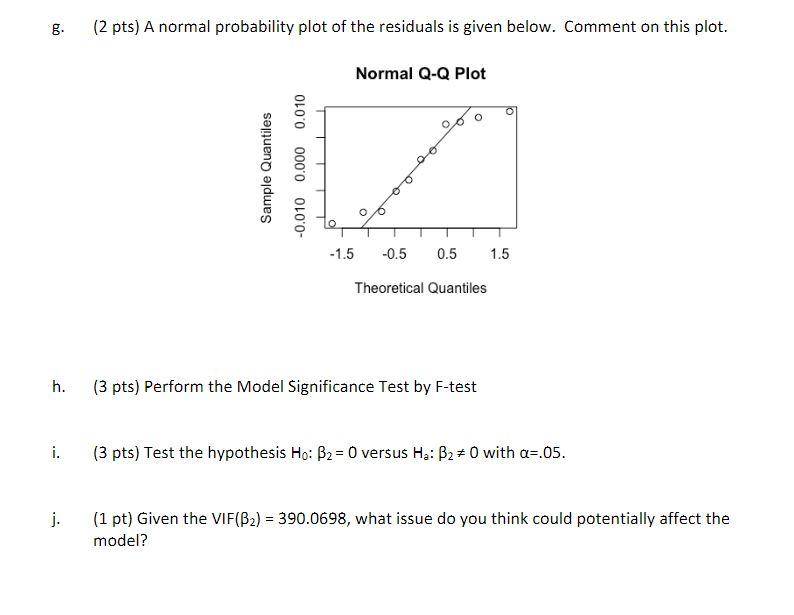
(20 pts) Consider the dataset given in Exercise 6-20, then answer following questions. a. (1 pt) What do you observe from the scatterplot matrix? 0.8 1.0 1.2 2.2 2.6 3.00.015 0.030 0.045 Density DielectricConstant 1.1 0.8 0.015 LossFactor 0.030 0.045 1.1 0.8 2.8 2.2 0.015 0.035 f. (2 pts) A plot of the residuals versus predicted values is given below. Does this plot suggest possible problems with the model? O 1.0 1.1 1.2 Residuals 0.010 -0.010 0.000 00 0.8 0.9 Numeric output from R: Call: Im(formula = Density DielectricConstant + LossFactor, data = ex 6.20) M Residuals: Min 1Q Median 3Q Max -0.0112404 -0.0070314 0.0008422 0.0077019 0.0098885 Coefficients: Estimate Std. Error t value Pr(>ltl) (Intercept) 0.2501 -0.442 0.6703 -0.1105 DielectricConstant 0.4072 0.1682 2.421 0.0418 * LossFactor 2.1080 5.8336 0.361 0.7272 Signif. codes: 0 **** 0.001 *** 0.01 * 0.05 0.11 Residual standard error: 0.008834 on 8 degrees of freedom Multiple R-squared: 0.9974, Adjusted R-squared: 0.9967 F-statistic: 1510 on 2 and 8 DF, p-value: 4.877e-11 b. (3 pts) Write out the fitted multiple regression model. C. (1 pt) What is the estimate of o? d. (2 pts) Find the predicted Density given Dielectric Constant is 2.4 and Loss Factor is 0.026, then compute the residual when Density = 0.929. e. (2 pts) Compute the coefficient of determination R and provide a brief comment on this value. f. (2 pts) A plot of the residuals versus predicted values is given below. Does this plot suggest possible problems with the model? O 1.0 1.1 1.2 Residuals 0.010 -0.010 0.000 00 0.8 0.9 g. (2 pts) A normal probability plot of the residuals is given below. Comment on this plot. Normal Q-Q Plot Theoretical Quantiles h. (3 pts) Perform the Model Significance Test by F-test i. (3 pts) Test the hypothesis Ho: B = 0 versus H: B #0 with a=.05. j. (1 pt) Given the VIF(B) = 390.0698, what issue do you think could potentially affect the model? Sample Quantiles 0.010 0.000 -0.010 -1.5 -0.5 0.5 1.5 (20 pts) Consider the dataset given in Exercise 6-20, then answer following questions. a. (1 pt) What do you observe from the scatterplot matrix? 0.8 1.0 1.2 2.2 2.6 3.00.015 0.030 0.045 Density DielectricConstant 1.1 0.8 0.015 LossFactor 0.030 0.045 1.1 0.8 2.8 2.2 0.015 0.035 f. (2 pts) A plot of the residuals versus predicted values is given below. Does this plot suggest possible problems with the model? O 1.0 1.1 1.2 Residuals 0.010 -0.010 0.000 00 0.8 0.9 Numeric output from R: Call: Im(formula = Density DielectricConstant + LossFactor, data = ex 6.20) M Residuals: Min 1Q Median 3Q Max -0.0112404 -0.0070314 0.0008422 0.0077019 0.0098885 Coefficients: Estimate Std. Error t value Pr(>ltl) (Intercept) 0.2501 -0.442 0.6703 -0.1105 DielectricConstant 0.4072 0.1682 2.421 0.0418 * LossFactor 2.1080 5.8336 0.361 0.7272 Signif. codes: 0 **** 0.001 *** 0.01 * 0.05 0.11 Residual standard error: 0.008834 on 8 degrees of freedom Multiple R-squared: 0.9974, Adjusted R-squared: 0.9967 F-statistic: 1510 on 2 and 8 DF, p-value: 4.877e-11 b. (3 pts) Write out the fitted multiple regression model. C. (1 pt) What is the estimate of o? d. (2 pts) Find the predicted Density given Dielectric Constant is 2.4 and Loss Factor is 0.026, then compute the residual when Density = 0.929. e. (2 pts) Compute the coefficient of determination R and provide a brief comment on this value. f. (2 pts) A plot of the residuals versus predicted values is given below. Does this plot suggest possible problems with the model? O 1.0 1.1 1.2 Residuals 0.010 -0.010 0.000 00 0.8 0.9 g. (2 pts) A normal probability plot of the residuals is given below. Comment on this plot. Normal Q-Q Plot Theoretical Quantiles h. (3 pts) Perform the Model Significance Test by F-test i. (3 pts) Test the hypothesis Ho: B = 0 versus H: B #0 with a=.05. j. (1 pt) Given the VIF(B) = 390.0698, what issue do you think could potentially affect the model? Sample Quantiles 0.010 0.000 -0.010 -1.5 -0.5 0.5 1.5
Step by Step Solution
There are 3 Steps involved in it

Get step-by-step solutions from verified subject matter experts