

Question: please show all work and explain. please use table 6. Students who complete their exams early certainly can intimidate the other students, but do the
please show all work and explain. please use table 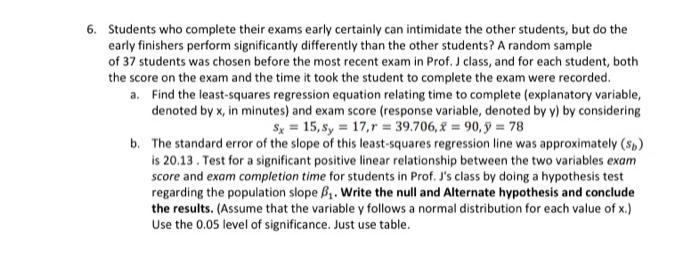
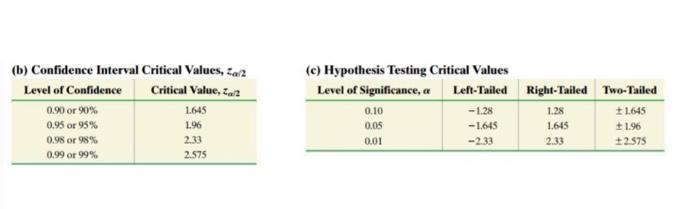
6. Students who complete their exams early certainly can intimidate the other students, but do the early finishers perform significantly differently than the other students? A random sample of 37 students was chosen before the most recent exam in Prof. I class, and for each student, both the score on the exam and the time it took the student to complete the exam were recorded. a. Find the least-squares regression equation relating time to complete (explanatory variable, denoted by x, in minutes) and exam score (response variable, denoted by v) by considering $x = 15, $y = 17.r = 39.706, X = 90,9 = 78 b. The standard error of the slope of this least-squares regression line was approximately (5) is 20.13. Test for a significant positive linear relationship between the two variables exam score and exam completion time for students in Prof. J's class by doing a hypothesis test regarding the population slope B. Write the null and Alternate hypothesis and conclude the results. (Assume that the variable y follows a normal distribution for each value of x.) Use the 0.05 level of significance. Just use table. (b) Confidence Interval Critical Values, 2a/2 Level of Confidence Critical Value, za2 0.90 or 90% 1645 0.95 or 95% 1.96 0.98 or 98% 0.99 or 99% 2.575 (e) Hypothesis Testing Critical Values Level of Significance, a Left-Tailed Right-Tailed Two-Tailed 0.10 -1.28 1.28 +1.645 0.05 -1.645 1645 11.96 0.01 -2.33 2.33 +2.575 2.33 6. Students who complete their exams early certainly can intimidate the other students, but do the early finishers perform significantly differently than the other students? A random sample of 37 students was chosen before the most recent exam in Prof. I class, and for each student, both the score on the exam and the time it took the student to complete the exam were recorded. a. Find the least-squares regression equation relating time to complete (explanatory variable, denoted by x, in minutes) and exam score (response variable, denoted by v) by considering $x = 15, $y = 17.r = 39.706, X = 90,9 = 78 b. The standard error of the slope of this least-squares regression line was approximately (5) is 20.13. Test for a significant positive linear relationship between the two variables exam score and exam completion time for students in Prof. J's class by doing a hypothesis test regarding the population slope B. Write the null and Alternate hypothesis and conclude the results. (Assume that the variable y follows a normal distribution for each value of x.) Use the 0.05 level of significance. Just use table. (b) Confidence Interval Critical Values, 2a/2 Level of Confidence Critical Value, za2 0.90 or 90% 1645 0.95 or 95% 1.96 0.98 or 98% 0.99 or 99% 2.575 (e) Hypothesis Testing Critical Values Level of Significance, a Left-Tailed Right-Tailed Two-Tailed 0.10 -1.28 1.28 +1.645 0.05 -1.645 1645 11.96 0.01 -2.33 2.33 +2.575 2.33 Step by Step Solution
There are 3 Steps involved in it
1 Expert Approved Answer
Step: 1 Unlock

Question Has Been Solved by an Expert!
Get step-by-step solutions from verified subject matter experts
Step: 2 Unlock
Step: 3 Unlock