

Question: Please show all work and provide Matlab code! 2. A tension test is performed on a material to determine stress for an applied strain. The
Please show all work and provide Matlab code!
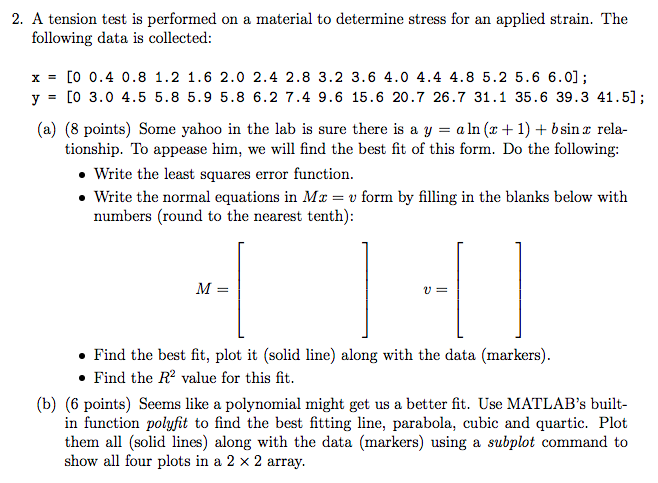
2. A tension test is performed on a material to determine stress for an applied strain. The following data is collected: x = [0 0.4 0.8 1.2 1.6 2.0 2.4 2.8 3.2 3.6 4.0 4.4 4.8 5.2 5.6 6.0]; y = [0 3.0 4.5 5.8 5.9 5.8 6.2 7.4 9.6 15.6 20 .7 26.7 31.1 35.6 39.3 41.5]; (a) (8 points) Some yahoo in the lab is sure there is a y = a ln (z+ 1) + b sin z rela- tionship. To appease him, we will find the best fit of this form. Do the following: Write the least squares error function Write the normal equations in Mz = u form by filling in the blanks below with numbers (round to the nearest tenth): M= Find the best fit, plot it (solid line) along with the data (markers). . Find the R2 value for this fit (b) (6 points) Seems like a polynomial might get us a better it. Use MATLAB's built- in function polyfit to find the best fitting line, parabola, cubic and quartic. Plot them all (solid lines) along with the data (markers) using a subplot command to show all four plots in a 2 x 2 array. 2. A tension test is performed on a material to determine stress for an applied strain. The following data is collected: x = [0 0.4 0.8 1.2 1.6 2.0 2.4 2.8 3.2 3.6 4.0 4.4 4.8 5.2 5.6 6.0]; y = [0 3.0 4.5 5.8 5.9 5.8 6.2 7.4 9.6 15.6 20 .7 26.7 31.1 35.6 39.3 41.5]; (a) (8 points) Some yahoo in the lab is sure there is a y = a ln (z+ 1) + b sin z rela- tionship. To appease him, we will find the best fit of this form. Do the following: Write the least squares error function Write the normal equations in Mz = u form by filling in the blanks below with numbers (round to the nearest tenth): M= Find the best fit, plot it (solid line) along with the data (markers). . Find the R2 value for this fit (b) (6 points) Seems like a polynomial might get us a better it. Use MATLAB's built- in function polyfit to find the best fitting line, parabola, cubic and quartic. Plot them all (solid lines) along with the data (markers) using a subplot command to show all four plots in a 2 x 2 array
Step by Step Solution
There are 3 Steps involved in it

Get step-by-step solutions from verified subject matter experts