

Question: Please show all work and steps 3. The following data set represents the number vehicles that drove through a toll-booth over a 12 hour period.
Please show all work and steps
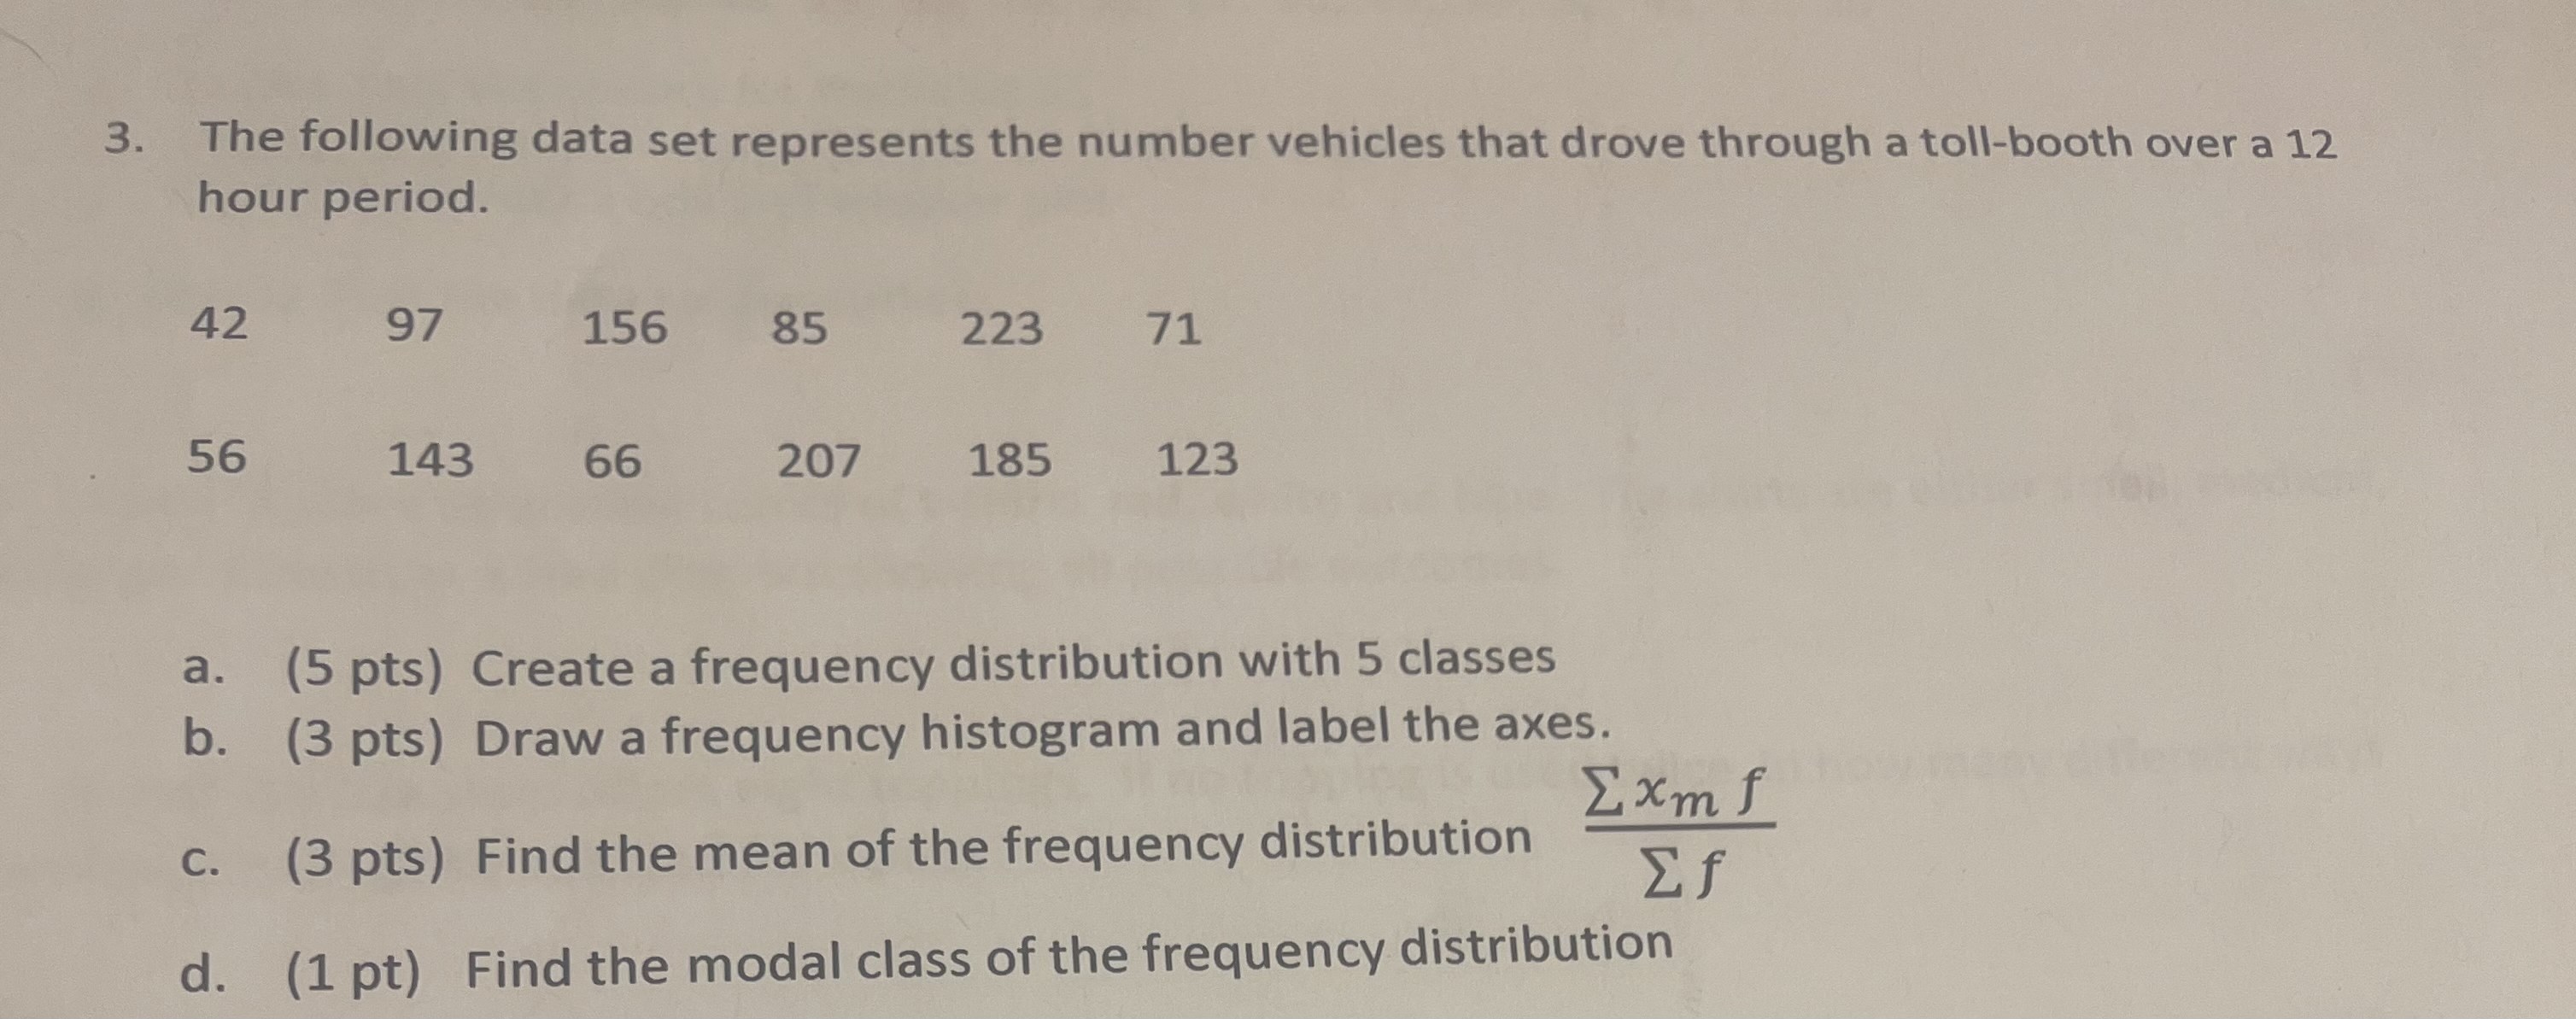
3. The following data set represents the number vehicles that drove through a toll-booth over a 12 hour period. 42 97 156 85 223 71 56 143 66 207 185 123 a. (5 pts) Create a frequency distribution with 5 classes b. (3 pts) Draw a frequency histogram and label the axes. Exms c. (3 pts) Find the mean of the frequency distribution Ef d. (1 pt) Find the modal class of the frequency distribution
Step by Step Solution
There are 3 Steps involved in it
1 Expert Approved Answer
Step: 1 Unlock

Question Has Been Solved by an Expert!
Get step-by-step solutions from verified subject matter experts
Step: 2 Unlock
Step: 3 Unlock