

Question: please show all work and steps Burpsy Cola has been producing fine carbonated beverages since 1926 in Stinking Creek, Tennessee. The current product line includes
please show all work and steps 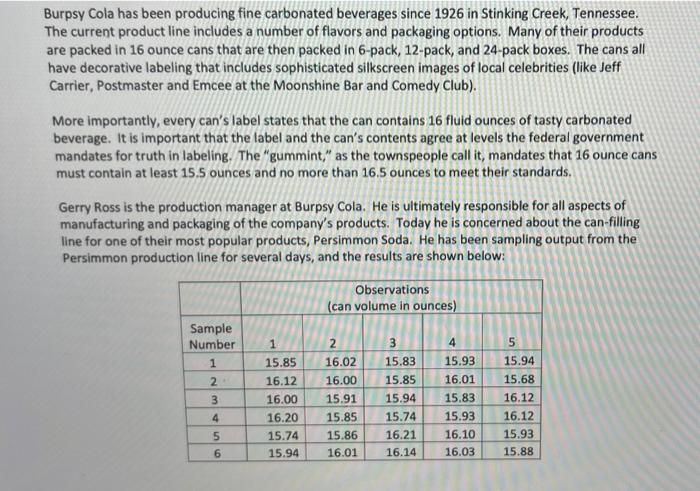
Burpsy Cola has been producing fine carbonated beverages since 1926 in Stinking Creek, Tennessee. The current product line includes a number of flavors and packaging options. Many of their products are packed in 16 ounce cans that are then packed in 6-pack, 12-pack, and 24-pack boxes. The cans all have decorative labeling that includes sophisticated silkscreen images of local celebrities (like Jeff Carrier, Postmaster and Emcee at the Moonshine Bar and Comedy Club). More importantly, every can's label states that the can contains 16 fluid Ounces of tasty carbonated beverage. It is important that the label and the can's contents agree at levels the federal government mandates for truth in labeling, The "gummint," as the townspeople call it, mandates that 16 ounce cans must contain at least 15.5 ounces and no more than 16,5 ounces to meet their standards. Gerry Ross is the production manager at Burpsy Cola. He is ultimately responsible for all aspects of manufacturing and packaging of the company's products. Today he is concerned about the can-filling line for one of their most popular products, Persimmon Soda. He has been sampling output from the Persimmon production line for several days, and the results are shown below: Observations (can volume in ounces) Sample Number 1 4 5 2 3 1 15.85 16.12 16.00 16.20 15.74 15.94 2 16.02 16.00 15.91 15.85 15.86 16.01 3 15.83 15.85 15.94 15.74 16.21 16.14 15.93 16.01 15.83 15.93 16.10 16.03 15.94 15.68 16.12 16.12 15.93 15.88 4 5 6 Please answer the following questions related to Gerry's analysis. a) Please calculate the process capability (Cox) for Gerry's analysis. Use the mean and standard deviation from Gerry's samples above to calculate the process capability. Once you calculate the number, please state briefly (three sentences or less) what the number indicates about the process b) Please use the data above to prepare control limits needed for the construction of an X chart and an R chart. Assume a confidence level of 30. Draw the charts. Burpsy Cola has been producing fine carbonated beverages since 1926 in Stinking Creek, Tennessee. The current product line includes a number of flavors and packaging options. Many of their products are packed in 16 ounce cans that are then packed in 6-pack, 12-pack, and 24-pack boxes. The cans all have decorative labeling that includes sophisticated silkscreen images of local celebrities (like Jeff Carrier, Postmaster and Emcee at the Moonshine Bar and Comedy Club). More importantly, every can's label states that the can contains 16 fluid Ounces of tasty carbonated beverage. It is important that the label and the can's contents agree at levels the federal government mandates for truth in labeling, The "gummint," as the townspeople call it, mandates that 16 ounce cans must contain at least 15.5 ounces and no more than 16,5 ounces to meet their standards. Gerry Ross is the production manager at Burpsy Cola. He is ultimately responsible for all aspects of manufacturing and packaging of the company's products. Today he is concerned about the can-filling line for one of their most popular products, Persimmon Soda. He has been sampling output from the Persimmon production line for several days, and the results are shown below: Observations (can volume in ounces) Sample Number 1 4 5 2 3 1 15.85 16.12 16.00 16.20 15.74 15.94 2 16.02 16.00 15.91 15.85 15.86 16.01 3 15.83 15.85 15.94 15.74 16.21 16.14 15.93 16.01 15.83 15.93 16.10 16.03 15.94 15.68 16.12 16.12 15.93 15.88 4 5 6 Please answer the following questions related to Gerry's analysis. a) Please calculate the process capability (Cox) for Gerry's analysis. Use the mean and standard deviation from Gerry's samples above to calculate the process capability. Once you calculate the number, please state briefly (three sentences or less) what the number indicates about the process b) Please use the data above to prepare control limits needed for the construction of an X chart and an R chart. Assume a confidence level of 30. Draw the charts Step by Step Solution
There are 3 Steps involved in it
1 Expert Approved Answer
Step: 1 Unlock

Question Has Been Solved by an Expert!
Get step-by-step solutions from verified subject matter experts
Step: 2 Unlock
Step: 3 Unlock