

Question: please show all work and steps for B C D and E 13. | Fishing: Trout The following data are based on information taken from
please show all work and steps for B C D and E
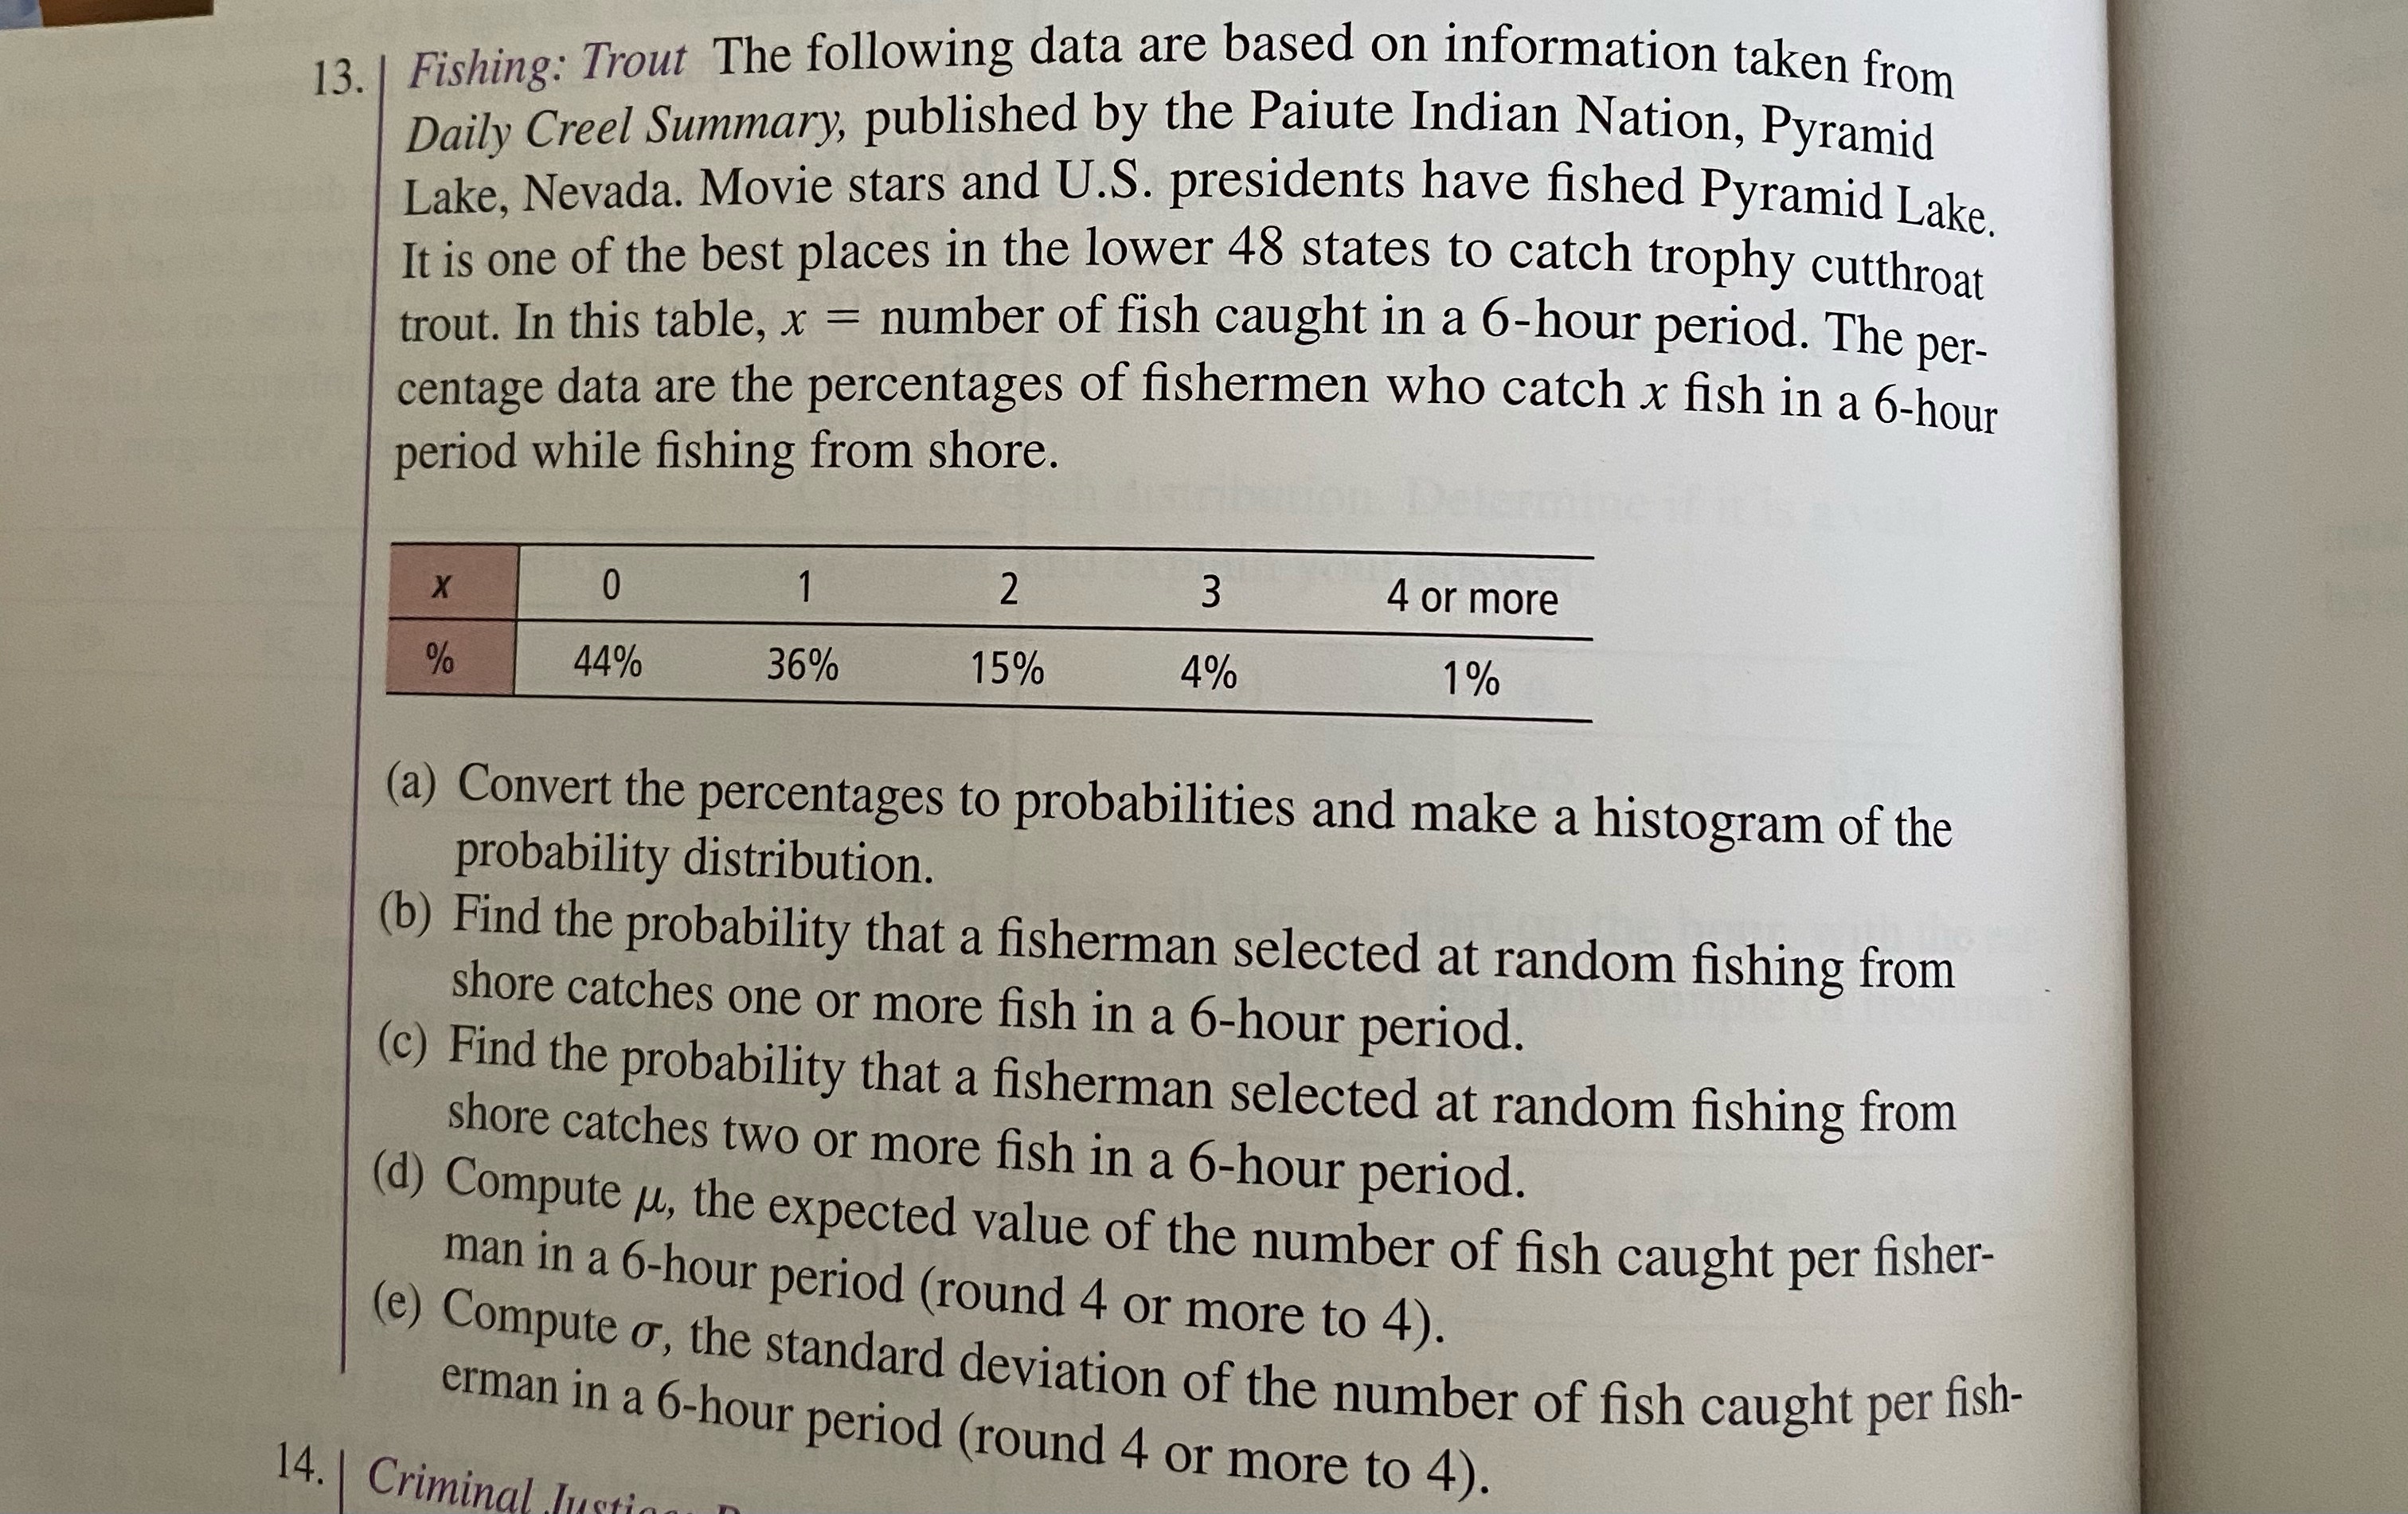
13. | Fishing: Trout The following data are based on information taken from Daily Creel Summary, published by the Paiute Indian Nation, Pyramid Lake, Nevada. Movie stars and U.S. presidents have fished Pyramid Lake. It is one of the best places in the lower 48 states to catch trophy cutthroat trout. In this table, x = number of fish caught in a 6-hour period. The per- centage data are the percentages of fishermen who catch x fish in a 6-hour period while fishing from shore. X 0 1 2 w 4 or more % 44% 36% 15% 4% 1% (a) Convert the percentages to probabilities and make a histogram of the probability distribution. (b) Find the probability that a fisherman selected at random fishing from shore catches one or more fish in a 6-hour period. (c) Find the probability that a fisherman selected at random fishing from shore catches two or more fish in a 6-hour period. (d) Compute u, the expected value of the number of fish caught per fisher- man in a 6-hour period (round 4 or more to 4). (e) Compute o, the standard deviation of the number of fish caught per fish- erman in a 6-hour period (round 4 or more to 4). 14. | Criminal Just
Step by Step Solution
There are 3 Steps involved in it

Get step-by-step solutions from verified subject matter experts