

Question: please show all work and use excel or other graphs if needed ty! You want to develop an R-chart. You know the average range is
please show all work and use excel or other graphs if needed ty!
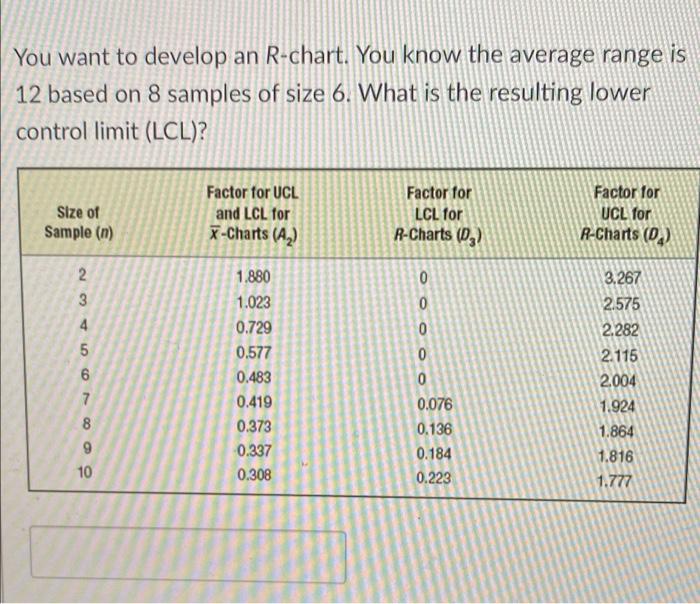
You want to develop an R-chart. You know the average range is 12 based on 8 samples of size 6. What is the resulting lower control limit (LCL)? Size of Sample (n) Factor for UCL and LCL for X-Charts (A2) Factor for LCL for R-Charts (0) Factor for UCL for R-Charts (0) 2 CONAN 4 5 6 1.880 1.023 0.729 0.577 0.483 0.419 0.373 0.337 0.308 0 0 0 0 0 0.076 0.136 0.184 0.223 3.267 2.575 2.282 2.115 2004 1.924 1.864 1.816 1.777 7 8 9 10
Step by Step Solution
There are 3 Steps involved in it
1 Expert Approved Answer
Step: 1 Unlock

Question Has Been Solved by an Expert!
Get step-by-step solutions from verified subject matter experts
Step: 2 Unlock
Step: 3 Unlock