

Question: PLEASE SHOW ALL WORK & CALCULATIONS. Problem 15.6 and Exhibit 15.8 for reference is below. Refer to the table developed in Problem 15.6 for the
PLEASE SHOW ALL WORK & CALCULATIONS.
Problem 15.6 and Exhibit 15.8 for reference is below.
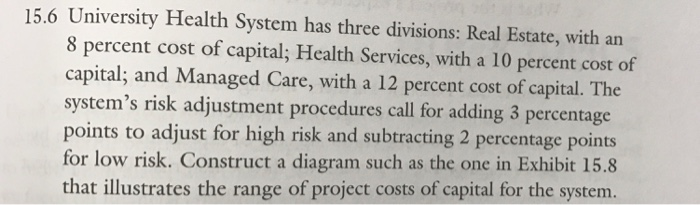
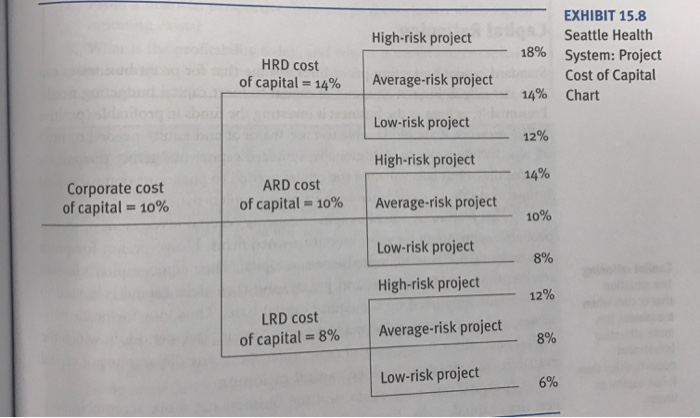
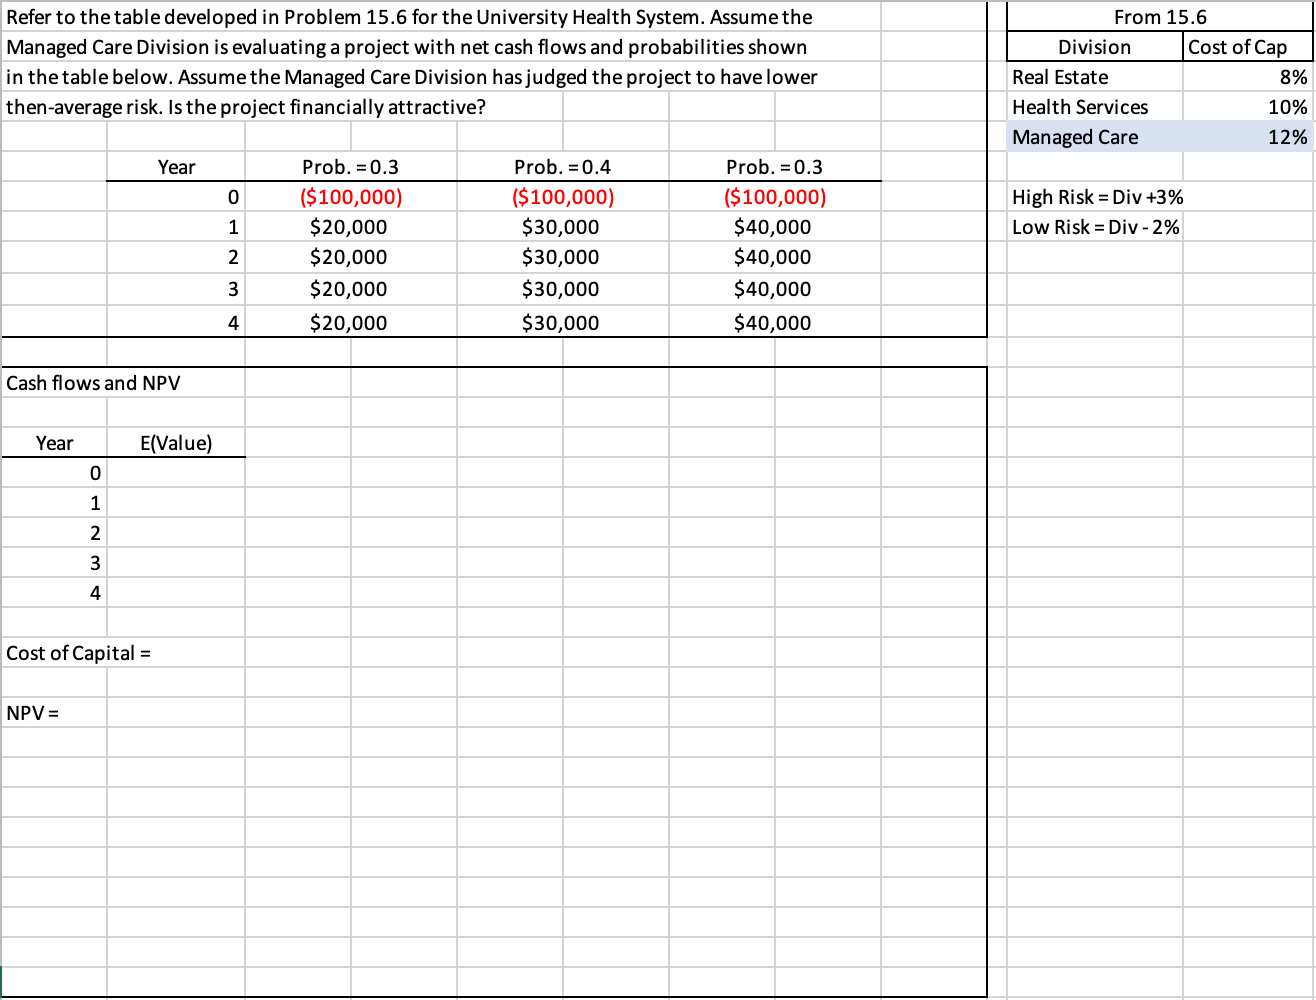
Refer to the table developed in Problem 15.6 for the University Health System. Assume the Managed Care Division is evaluating a project with net cash flows and probabilities shown in the table below. Assume the Managed Care Division has judged the project to have lower then-average risk. Is the project financially attractive? From 15.6 Division Cost of Cap Real Estate 8% Health Services 10% Managed Care 12% Year 0 High Risk = Div +3% Low Risk = Div - 2% 1 Prob. = 0.3 ($100,000) $20,000 $20,000 $20,000 $20,000 Prob. = 0.4 ($100,000) $30,000 $30,000 $30,000 $30,000 Prob. = 0.3 ($100,000) $40,000 $40,000 $40,000 $40,000 2 3 4 Cash flows and NPV Year E(Value) 0 1 2 3 4 Cost of Capital = NPV = 15.6 University Health System has three divisions: Real Estate, with an 8 percent cost of capital; Health Services, with a 10 percent cost of capital; and Managed Care, with a 12 percent cost of capital. The system's risk adjustment procedures call for adding 3 percentage points to adjust for high risk and subtracting 2 percentage points for low risk. Construct a diagram such as the one in Exhibit 15.8 that illustrates the range of project costs of capital for the system. High-risk project EXHIBIT 15.8 Seattle Health 18% System: Project Cost of Capital 14% Chart HRD cost of capital = 14% Average-risk project Low-risk project 12% High-risk project 14% Corporate cost of capital = 10% ARD cost of capital = 10% Average-risk project 10% Low-risk project 8% High-risk project 12% LRD cost of capital = 8% Average-risk project 8% Low-risk project 6%
Step by Step Solution
There are 3 Steps involved in it

Get step-by-step solutions from verified subject matter experts