

Question: please show all work Following Table contains data on examination of medical insurance claims. Every day 50 claims were examined. Assume the data follows a
please show all work
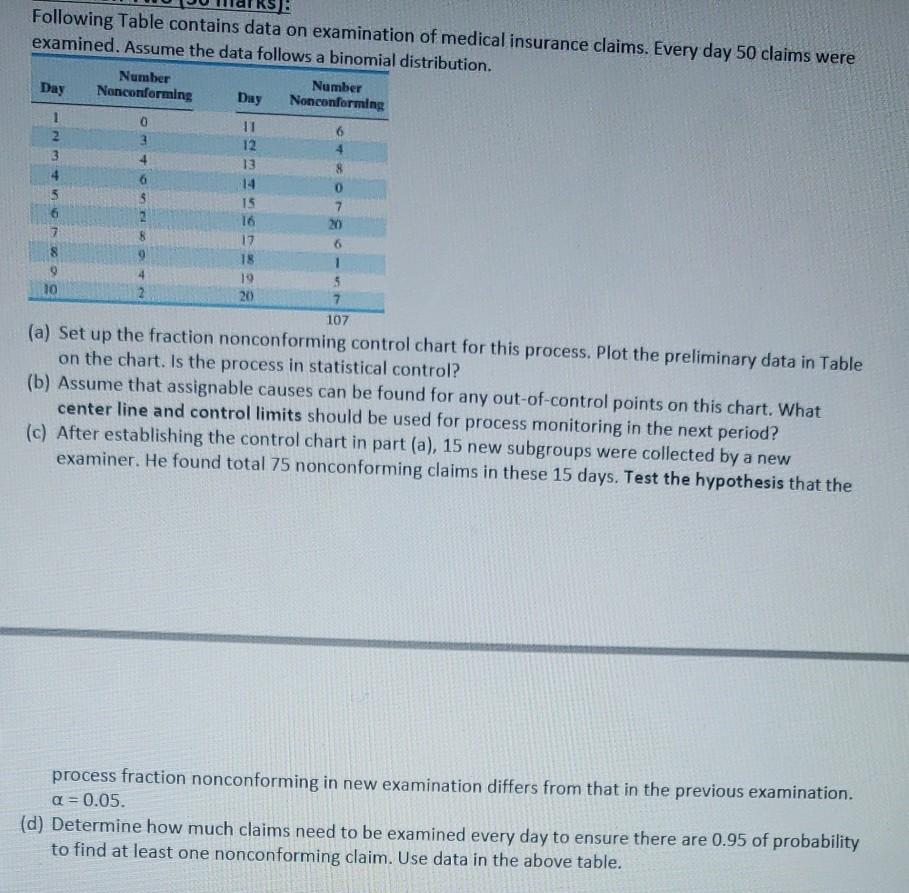
Following Table contains data on examination of medical insurance claims. Every day 50 claims were examined. Assume the data follows a binomial distribution. Number Number Nonconforming Day Nonconforming Day 1 0 3 3 11 12 13 14 15 16 17 18 19 20 8 0 7 20 6 1 5 7 107 10 2 (a) Set up the fraction nonconforming control chart for this process. Plot the preliminary data in Table on the chart. Is the process in statistical control? (b) Assume that assignable causes can be found for any out-of-control points on this chart. What center line and control limits should be used for process monitoring in the next period? (c) After establishing the control chart in part (a), 15 new subgroups were collected by a new examiner. He found total 75 nonconforming claims in these 15 days. Test the hypothesis that the process fraction nonconforming in new examination differs from that in the previous examination. a = 0.05. (d) Determine how much claims need to be examined every day to ensure there are 0.95 of probability to find at least one nonconforming claim. Use data in the above tableStep by Step Solution
There are 3 Steps involved in it
1 Expert Approved Answer
Step: 1 Unlock

Question Has Been Solved by an Expert!
Get step-by-step solutions from verified subject matter experts
Step: 2 Unlock
Step: 3 Unlock