

Question: please show all work for thumbs up with answer NU COUNTY 1 2 # OF OUTAGES 14 5 24 20 18 3 4 SAMPLE SIZE
please show all work for thumbs up with answer 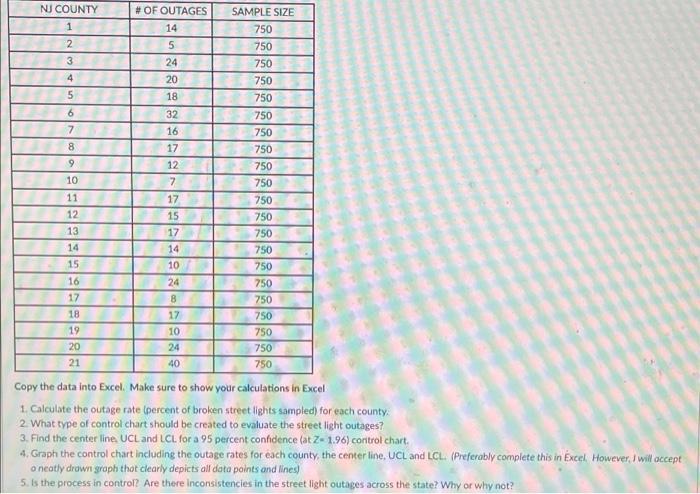
NU COUNTY 1 2 # OF OUTAGES 14 5 24 20 18 3 4 SAMPLE SIZE 750 750 750 750 750 750 750 750 5 6 7 8 750 750 750 9 10 11 12 13 14 15 750 32 16 17 12 7 17 15 17 14 10 24 8 17 10 24 40 16 17 18 19 750 750 750 750 750 750 750 750 750 20 21 Copy the data into Excel. Make sure to show your calculations in Excel 1. Calculate the outage rate (percent of broken street lights sampled) for each county: 2. What type of control chart should be created to evaluate the street light outages? 3. Find the center line. UCL and Cl. for a 95 percent conhdence (at Z-1.96) control chart, 4. Graph the control chart including the outage rates for each county, the center line, UCL and LCL (Preferably complete this in Excel. However, I will accept o neatly drown graph thot clearly depicts all data points and lines) 5. Is the process in control? Are there inconsistencies in the street light outages across the state? Why or why not
Step by Step Solution
There are 3 Steps involved in it
1 Expert Approved Answer
Step: 1 Unlock

Question Has Been Solved by an Expert!
Get step-by-step solutions from verified subject matter experts
Step: 2 Unlock
Step: 3 Unlock