

Question: Please show all work ( formulas etc... ) NO EXCEL. Thank you!! A pension fund manager is considering three mutual funds. The first is a
Please show all work formulas etc... NO EXCEL. Thank you!!
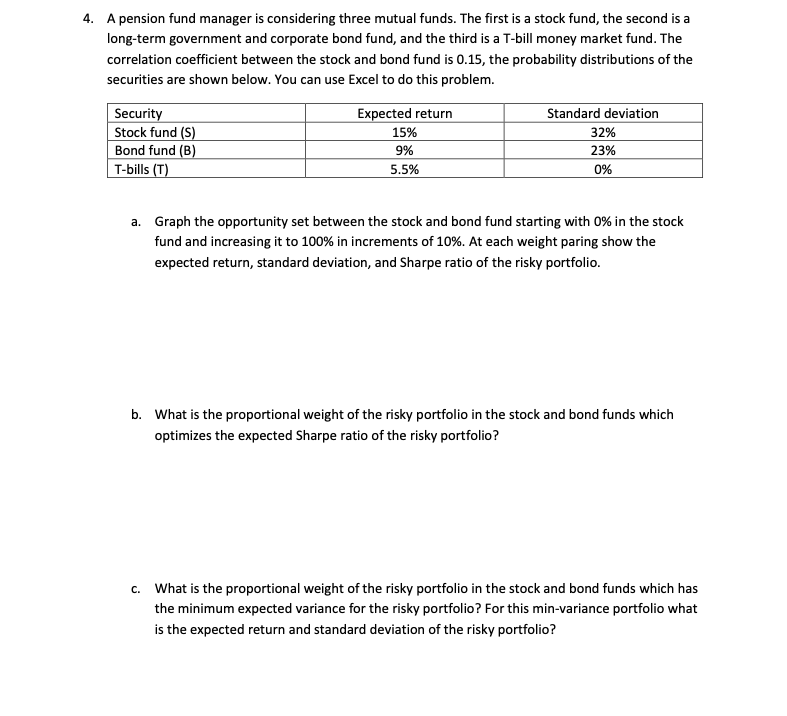
A pension fund manager is considering three mutual funds. The first is a stock fund, the second is a
longterm government and corporate bond fund, and the third is a Tbill money market fund. The
correlation coefficient between the stock and bond fund is the probability distributions of the
securities are shown below. You can use Excel to do this problem.
a Graph the opportunity set between the stock and bond fund starting with in the stock
fund and increasing it to in increments of At each weight paring show the
expected return, standard deviation, and Sharpe ratio of the risky portfolio.
b What is the proportional weight of the risky portfolio in the stock and bond funds which
optimizes the expected Sharpe ratio of the risky portfolio?
c What is the proportional weight of the risky portfolio in the stock and bond funds which has
the minimum expected variance for the risky portfolio? For this minvariance portfolio what
is the expected return and standard deviation of the risky portfolio?
Step by Step Solution
There are 3 Steps involved in it
1 Expert Approved Answer
Step: 1 Unlock

Question Has Been Solved by an Expert!
Get step-by-step solutions from verified subject matter experts
Step: 2 Unlock
Step: 3 Unlock