

Question: PLEASE SHOW ALL WORK!!! If you would like partial credit, clearly indicate your answer and show your work. Help me help you. You should explain
PLEASE SHOW ALL WORK!!!
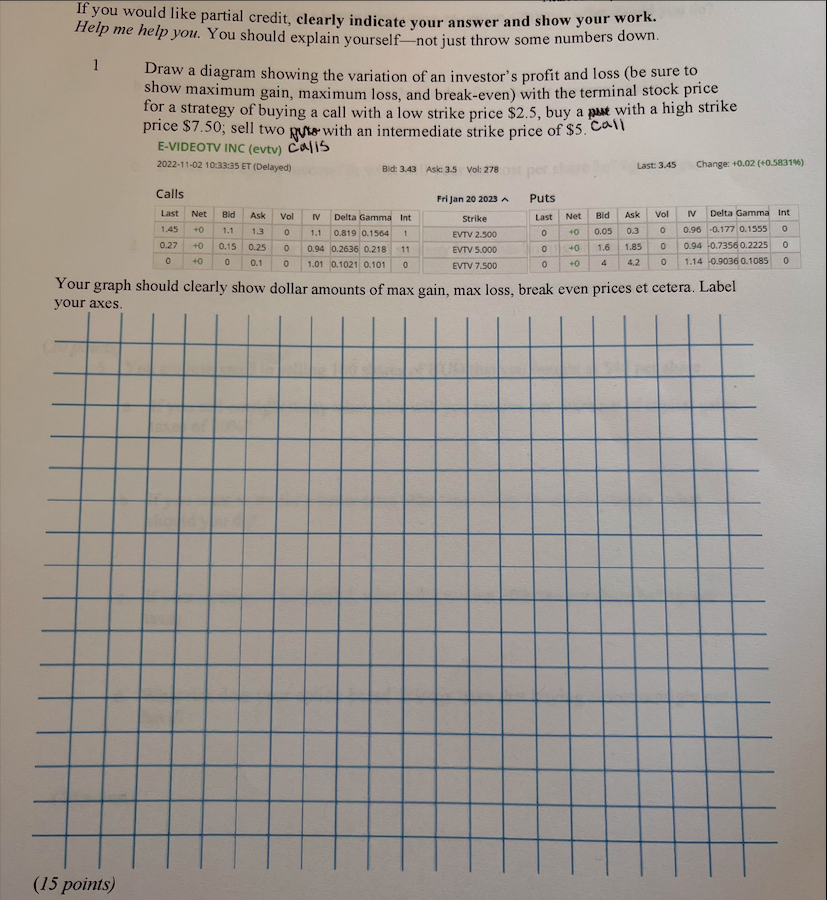
If you would like partial credit, clearly indicate your answer and show your work. Help me help you. You should explain yourself-not just throw some numbers down. 1 Draw a diagram showing the variation of an investor's profit and loss (be sure to show maximum gain, maximum loss, and break-even) with the terminal stock price for a strategy of buying a call with a low strike price $2.5, buy a put with a high strike price \$7.50; sell two puto with an intermediate strike price of $5. Call E-VIDEOTV INC (evtv) Calis 2022-11-02 10:33:35 ET (Delayed) Bid: 3.43 Ask: 3.5 Vol: 278 Last: 3.45 Change: +0.02(+0.583) Calls Your graph should clearly show dollar amounts of max gain, max loss, break even prices et cetera. Label your axes. If you would like partial credit, clearly indicate your answer and show your work. Help me help you. You should explain yourself-not just throw some numbers down. 1 Draw a diagram showing the variation of an investor's profit and loss (be sure to show maximum gain, maximum loss, and break-even) with the terminal stock price for a strategy of buying a call with a low strike price $2.5, buy a put with a high strike price \$7.50; sell two puto with an intermediate strike price of $5. Call E-VIDEOTV INC (evtv) Calis 2022-11-02 10:33:35 ET (Delayed) Bid: 3.43 Ask: 3.5 Vol: 278 Last: 3.45 Change: +0.02(+0.583) Calls Your graph should clearly show dollar amounts of max gain, max loss, break even prices et cetera. Label your axes
Step by Step Solution
There are 3 Steps involved in it

Get step-by-step solutions from verified subject matter experts