

Question: please show all work in excel. Homework for Chapter 6: Problem # 5 in the text (Chapter 6) NOTE: PLEASE USE THE ATTACHED EXCEL FILE
please show all work in excel.
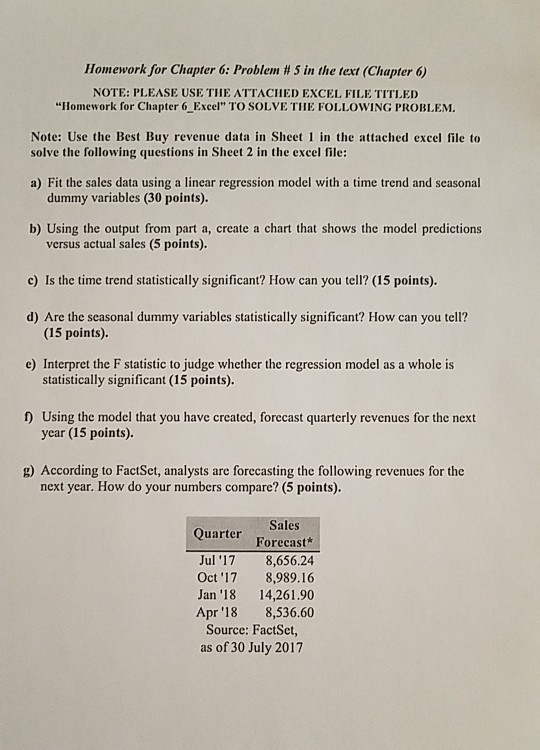
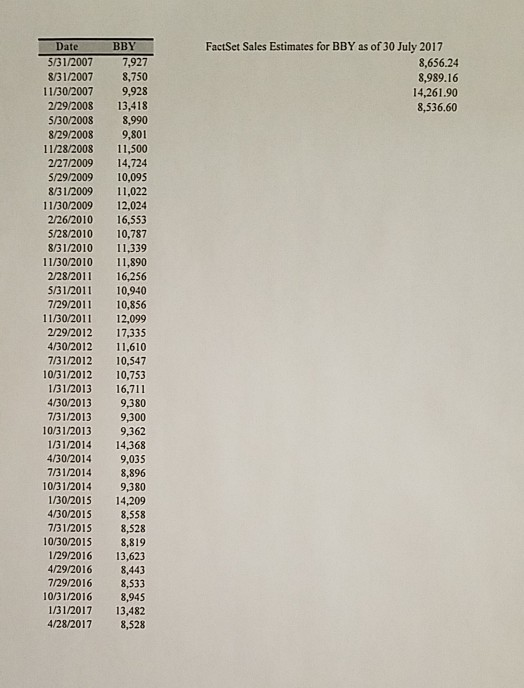
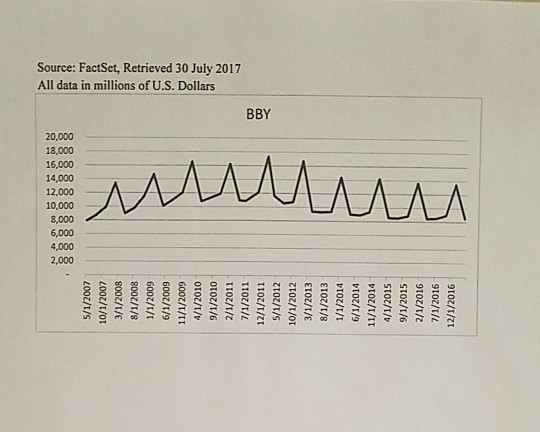
Homework for Chapter 6: Problem # 5 in the text (Chapter 6) NOTE: PLEASE USE THE ATTACHED EXCEL FILE TITLED "Homework for Chapter 6_Excel" TO SOLVE THE FOLLOWING PROBLEM. Note: Use the Best Buy revenue data in Sheet 1 in the attached excel file to solve the following questions in Sheet 2 in the excel file: a) Fit the sales data using a linear regression model with a time trend and seasonal dummy variables (30 points). b) Using the output from part a, create a chart that shows the model predictions versus actual sales (5 points). c) Is the time trend statistically significant? How can you tell? (15 points). d) Are the seasonal dummy variables statistically significant? How can you tell? (15 points) e) Interpret the F statistic to judge whether the regression model as a whole is statistically significant (15 points). 1) Using the model that you have created, forecast quarterly revenues for the next year (15 points). D) According to FactSet, analysts are forecasting the following revenues for the next year. How do your numbers compare? (5 points). Sales Quarter Forecast Jul '17 8,656.24 Oct '17 8,989.16 Jan '18 14,261.90 Apr '18 8,536.60 Source: FactSet, as of 30 July 2017 FactSet Sales Estimates for BBY as of 30 July 2017 8,656.24 8,989.16 14,261.90 8,536.60 DateBBY 5/31/2007 7,927 8/31/2007 8,750 11/30/2007 9,928 2/29/2008 13,418 5/30/2008 8,990 8/29/2008 9,801 11/28/2008 11,500 2/27/2009 14,724 5/29/2009 10,095 8/31/2009 11,022 11/30/2009 12,024 2/26/2010 16,553 5/28/2010 10,787 8/31/2010 11,339 11/30/2010 11,890 2/28/2011 16,256 5/31/2011 10,940 7/29/2011 10,856 11/30/2011 12,099 2/29/2012 17,335 4/30/2012 11,610 7/31/2012 10.547 10/31/2012 10,753 1/31/2013 16,711 4/30/2013 9,380 7/31/2013 9,300 10/31/2013 9,362 1/31/2014 14,368 4/30/2014 9,035 7/31/2014 8,896 10/31/2014 9,380 1/30/2015 14,209 4/30/2015 8,558 7/31/2015 8,528 10/30/2015 8,819 1/29/2016 13,623 4/29/2016 8,443 7/29/2016 8,533 10/31/2016 8,945 1/31/2017 13,482 4/28/2017 8,528 2,000 000' 000'9 8,000 10,000 12,000 14,000 16,000 18,000 20,000 All data in millions of U.S. Dollars Source: FactSet, Retrieved 30 July 2017 5/1/2007 10/1/2007 3/1/2008 8/1/2008 1/1/2009 6/1/2009 11/1/2009 4/1/2010 9/1/2010 2/1/2011 7/1/2011 12/1/2011 5/1/2012 10/1/2012 3/1/2013 8/1/2013 1/1/2014 6/1/2014 11/1/2014 4/1/2015 9/1/2015 2/1/2016 7/1/2016 12/1/2016 BBY Homework for Chapter 6: Problem # 5 in the text (Chapter 6) NOTE: PLEASE USE THE ATTACHED EXCEL FILE TITLED "Homework for Chapter 6_Excel" TO SOLVE THE FOLLOWING PROBLEM. Note: Use the Best Buy revenue data in Sheet 1 in the attached excel file to solve the following questions in Sheet 2 in the excel file: a) Fit the sales data using a linear regression model with a time trend and seasonal dummy variables (30 points). b) Using the output from part a, create a chart that shows the model predictions versus actual sales (5 points). c) Is the time trend statistically significant? How can you tell? (15 points). d) Are the seasonal dummy variables statistically significant? How can you tell? (15 points) e) Interpret the F statistic to judge whether the regression model as a whole is statistically significant (15 points). 1) Using the model that you have created, forecast quarterly revenues for the next year (15 points). D) According to FactSet, analysts are forecasting the following revenues for the next year. How do your numbers compare? (5 points). Sales Quarter Forecast Jul '17 8,656.24 Oct '17 8,989.16 Jan '18 14,261.90 Apr '18 8,536.60 Source: FactSet, as of 30 July 2017 FactSet Sales Estimates for BBY as of 30 July 2017 8,656.24 8,989.16 14,261.90 8,536.60 DateBBY 5/31/2007 7,927 8/31/2007 8,750 11/30/2007 9,928 2/29/2008 13,418 5/30/2008 8,990 8/29/2008 9,801 11/28/2008 11,500 2/27/2009 14,724 5/29/2009 10,095 8/31/2009 11,022 11/30/2009 12,024 2/26/2010 16,553 5/28/2010 10,787 8/31/2010 11,339 11/30/2010 11,890 2/28/2011 16,256 5/31/2011 10,940 7/29/2011 10,856 11/30/2011 12,099 2/29/2012 17,335 4/30/2012 11,610 7/31/2012 10.547 10/31/2012 10,753 1/31/2013 16,711 4/30/2013 9,380 7/31/2013 9,300 10/31/2013 9,362 1/31/2014 14,368 4/30/2014 9,035 7/31/2014 8,896 10/31/2014 9,380 1/30/2015 14,209 4/30/2015 8,558 7/31/2015 8,528 10/30/2015 8,819 1/29/2016 13,623 4/29/2016 8,443 7/29/2016 8,533 10/31/2016 8,945 1/31/2017 13,482 4/28/2017 8,528 2,000 000' 000'9 8,000 10,000 12,000 14,000 16,000 18,000 20,000 All data in millions of U.S. Dollars Source: FactSet, Retrieved 30 July 2017 5/1/2007 10/1/2007 3/1/2008 8/1/2008 1/1/2009 6/1/2009 11/1/2009 4/1/2010 9/1/2010 2/1/2011 7/1/2011 12/1/2011 5/1/2012 10/1/2012 3/1/2013 8/1/2013 1/1/2014 6/1/2014 11/1/2014 4/1/2015 9/1/2015 2/1/2016 7/1/2016 12/1/2016 BBY
Step by Step Solution
There are 3 Steps involved in it

Get step-by-step solutions from verified subject matter experts