

Question: Please show all work step by step. Thank you Almost every AP Stats class uses food as a motivator! One favorite AP Stats activity is
Please show all work step by step. Thank you
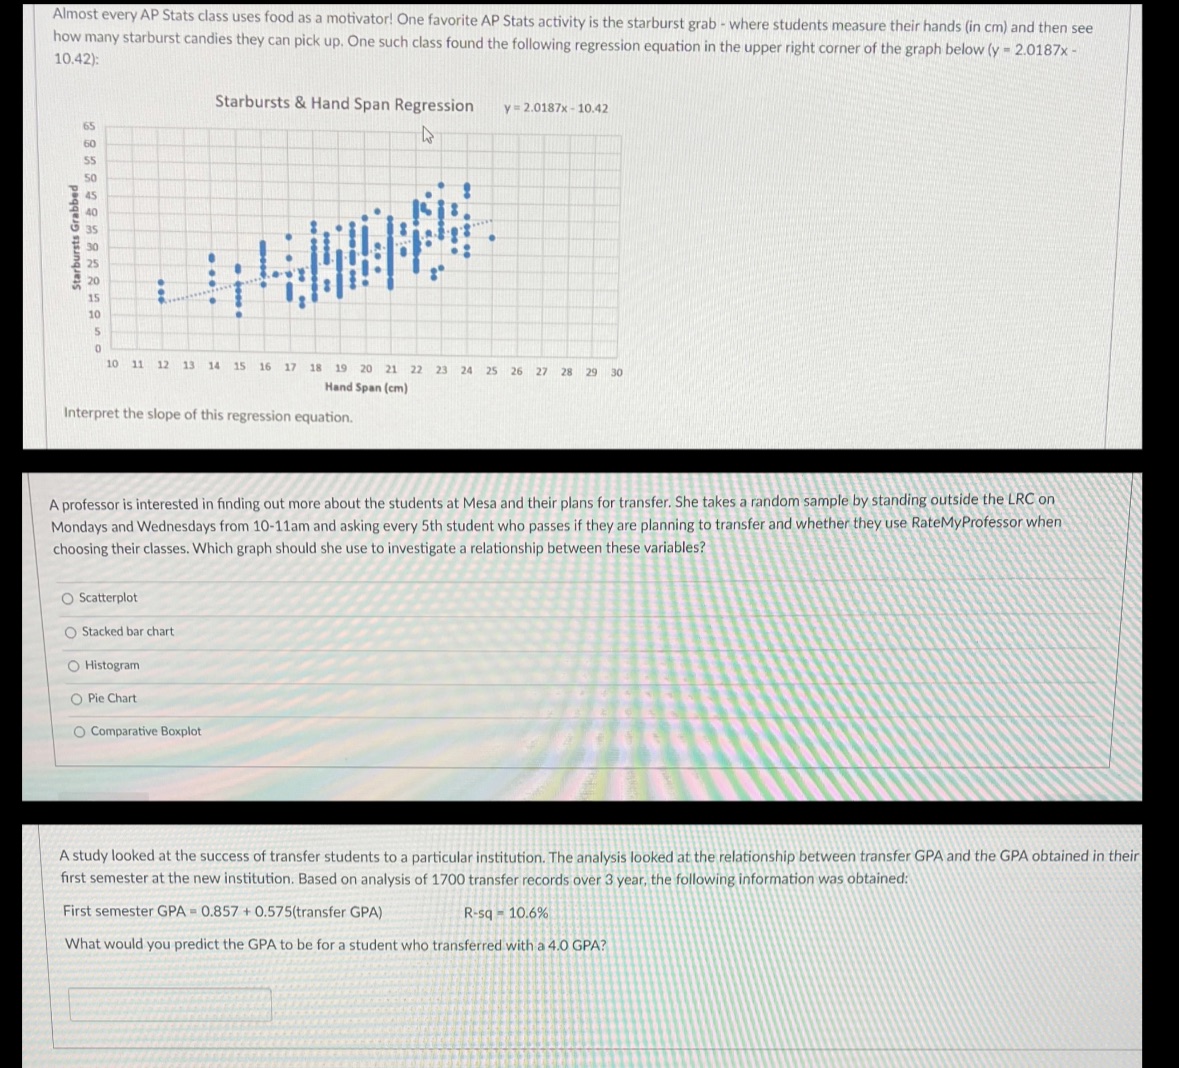
Almost every AP Stats class uses food as a motivator! One favorite AP Stats activity is the starburst grab - where students measure their hands (in cm) and then see how many starburst candies they can pick up. One such class found the following regression equation in the upper right corner of the graph below (y - 2.0187x - 10.42): Starbursts & Hand Span Regression Y = 2.0187x - 10.42 Starbursts Grabbed 10 11 12 13 14 15 16 17 18 19 20 21 22 23 24 25 26 27 28 29 30 Hand Span (cm) Interpret the slope of this regression equation. A professor is interested in finding out more about the students at Mesa and their plans for transfer. She takes a random sample by standing outside the LRC on Mondays and Wednesdays from 10-11am and asking every 5th student who passes if they are planning to transfer and whether they use RateMyProfessor when choosing their classes. Which graph should she use to investigate a relationship between these variables? Scatterplot O Stacked bar chart O Histogram O Pie Chart O Comparative Boxplot A study looked at the success of transfer students to a particular institution. The analysis looked at the relationship between transfer GPA and the GPA obtained in their first semester at the new institution. Based on analysis of 1700 transfer records over 3 year, the following information was obtained: First semester GPA = 0.857 + 0.575(transfer GPA) R-sq - 10.6% What would you predict the GPA to be for a student who transferred with a 4.0 GPA
Step by Step Solution
There are 3 Steps involved in it

Get step-by-step solutions from verified subject matter experts