

Question: please show all work, thanks! Use the chart above to answer the following question: e. What is the average time spent in the system in
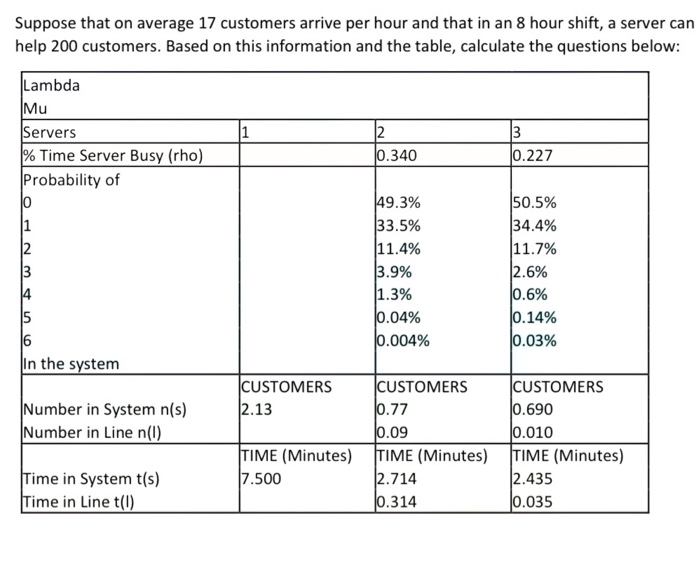
please show all work, thanks!
Use the chart above to answer the following question:
e. What is the average time spent in the system in a three-server model? Give your answer
in seconds. 146.1 seconds
Step by Step Solution
There are 3 Steps involved in it
1 Expert Approved Answer
Step: 1 Unlock

Question Has Been Solved by an Expert!
Get step-by-step solutions from verified subject matter experts
Step: 2 Unlock
Step: 3 Unlock