

Question: PLEASE SHOW ALL WORK Two observable quality characteristic x1 and x2 of a production process is recorded for m=50 samples with a sample size of
PLEASE SHOW ALL WORK
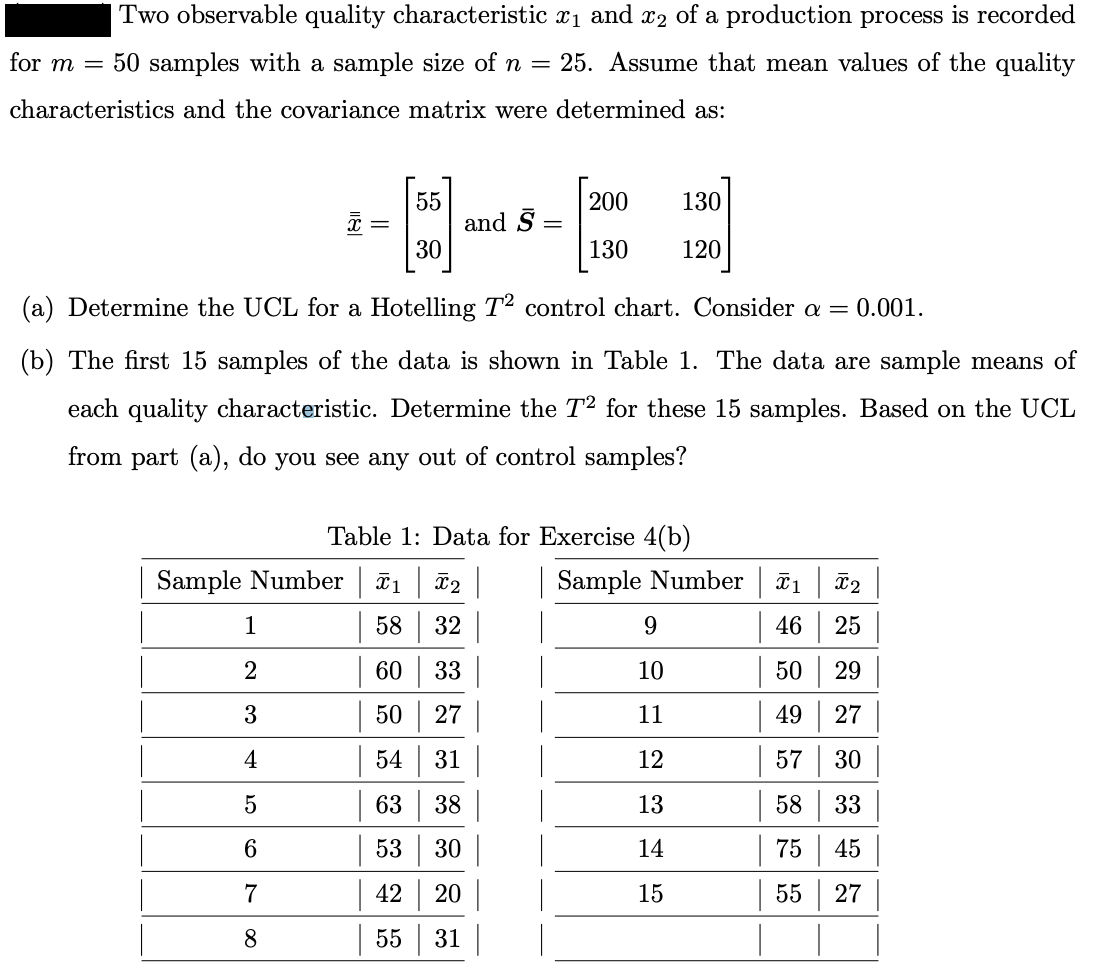
Two observable quality characteristic x1 and x2 of a production process is recorded for m=50 samples with a sample size of n=25. Assume that mean values of the quality characteristics and the covariance matrix were determined as: x=[5530]andS=[200130130120] (a) Determine the UCL for a Hotelling T2 control chart. Consider =0.001. (b) The first 15 samples of the data is shown in Table 1. The data are sample means of each quality characteristic. Determine the T2 for these 15 samples. Based on the UCL from part (a), do you see any out of control samples? Table 1: Data for Exercise 4(b)
Step by Step Solution
There are 3 Steps involved in it
1 Expert Approved Answer
Step: 1 Unlock

Question Has Been Solved by an Expert!
Get step-by-step solutions from verified subject matter experts
Step: 2 Unlock
Step: 3 Unlock