

Question: Please show all work with instructions and use statdisk, ti 84, or crunch it and post the results. Two teaching methods and their effects on
Please show all work with instructions and use statdisk, ti 84, or crunch it and post the results.
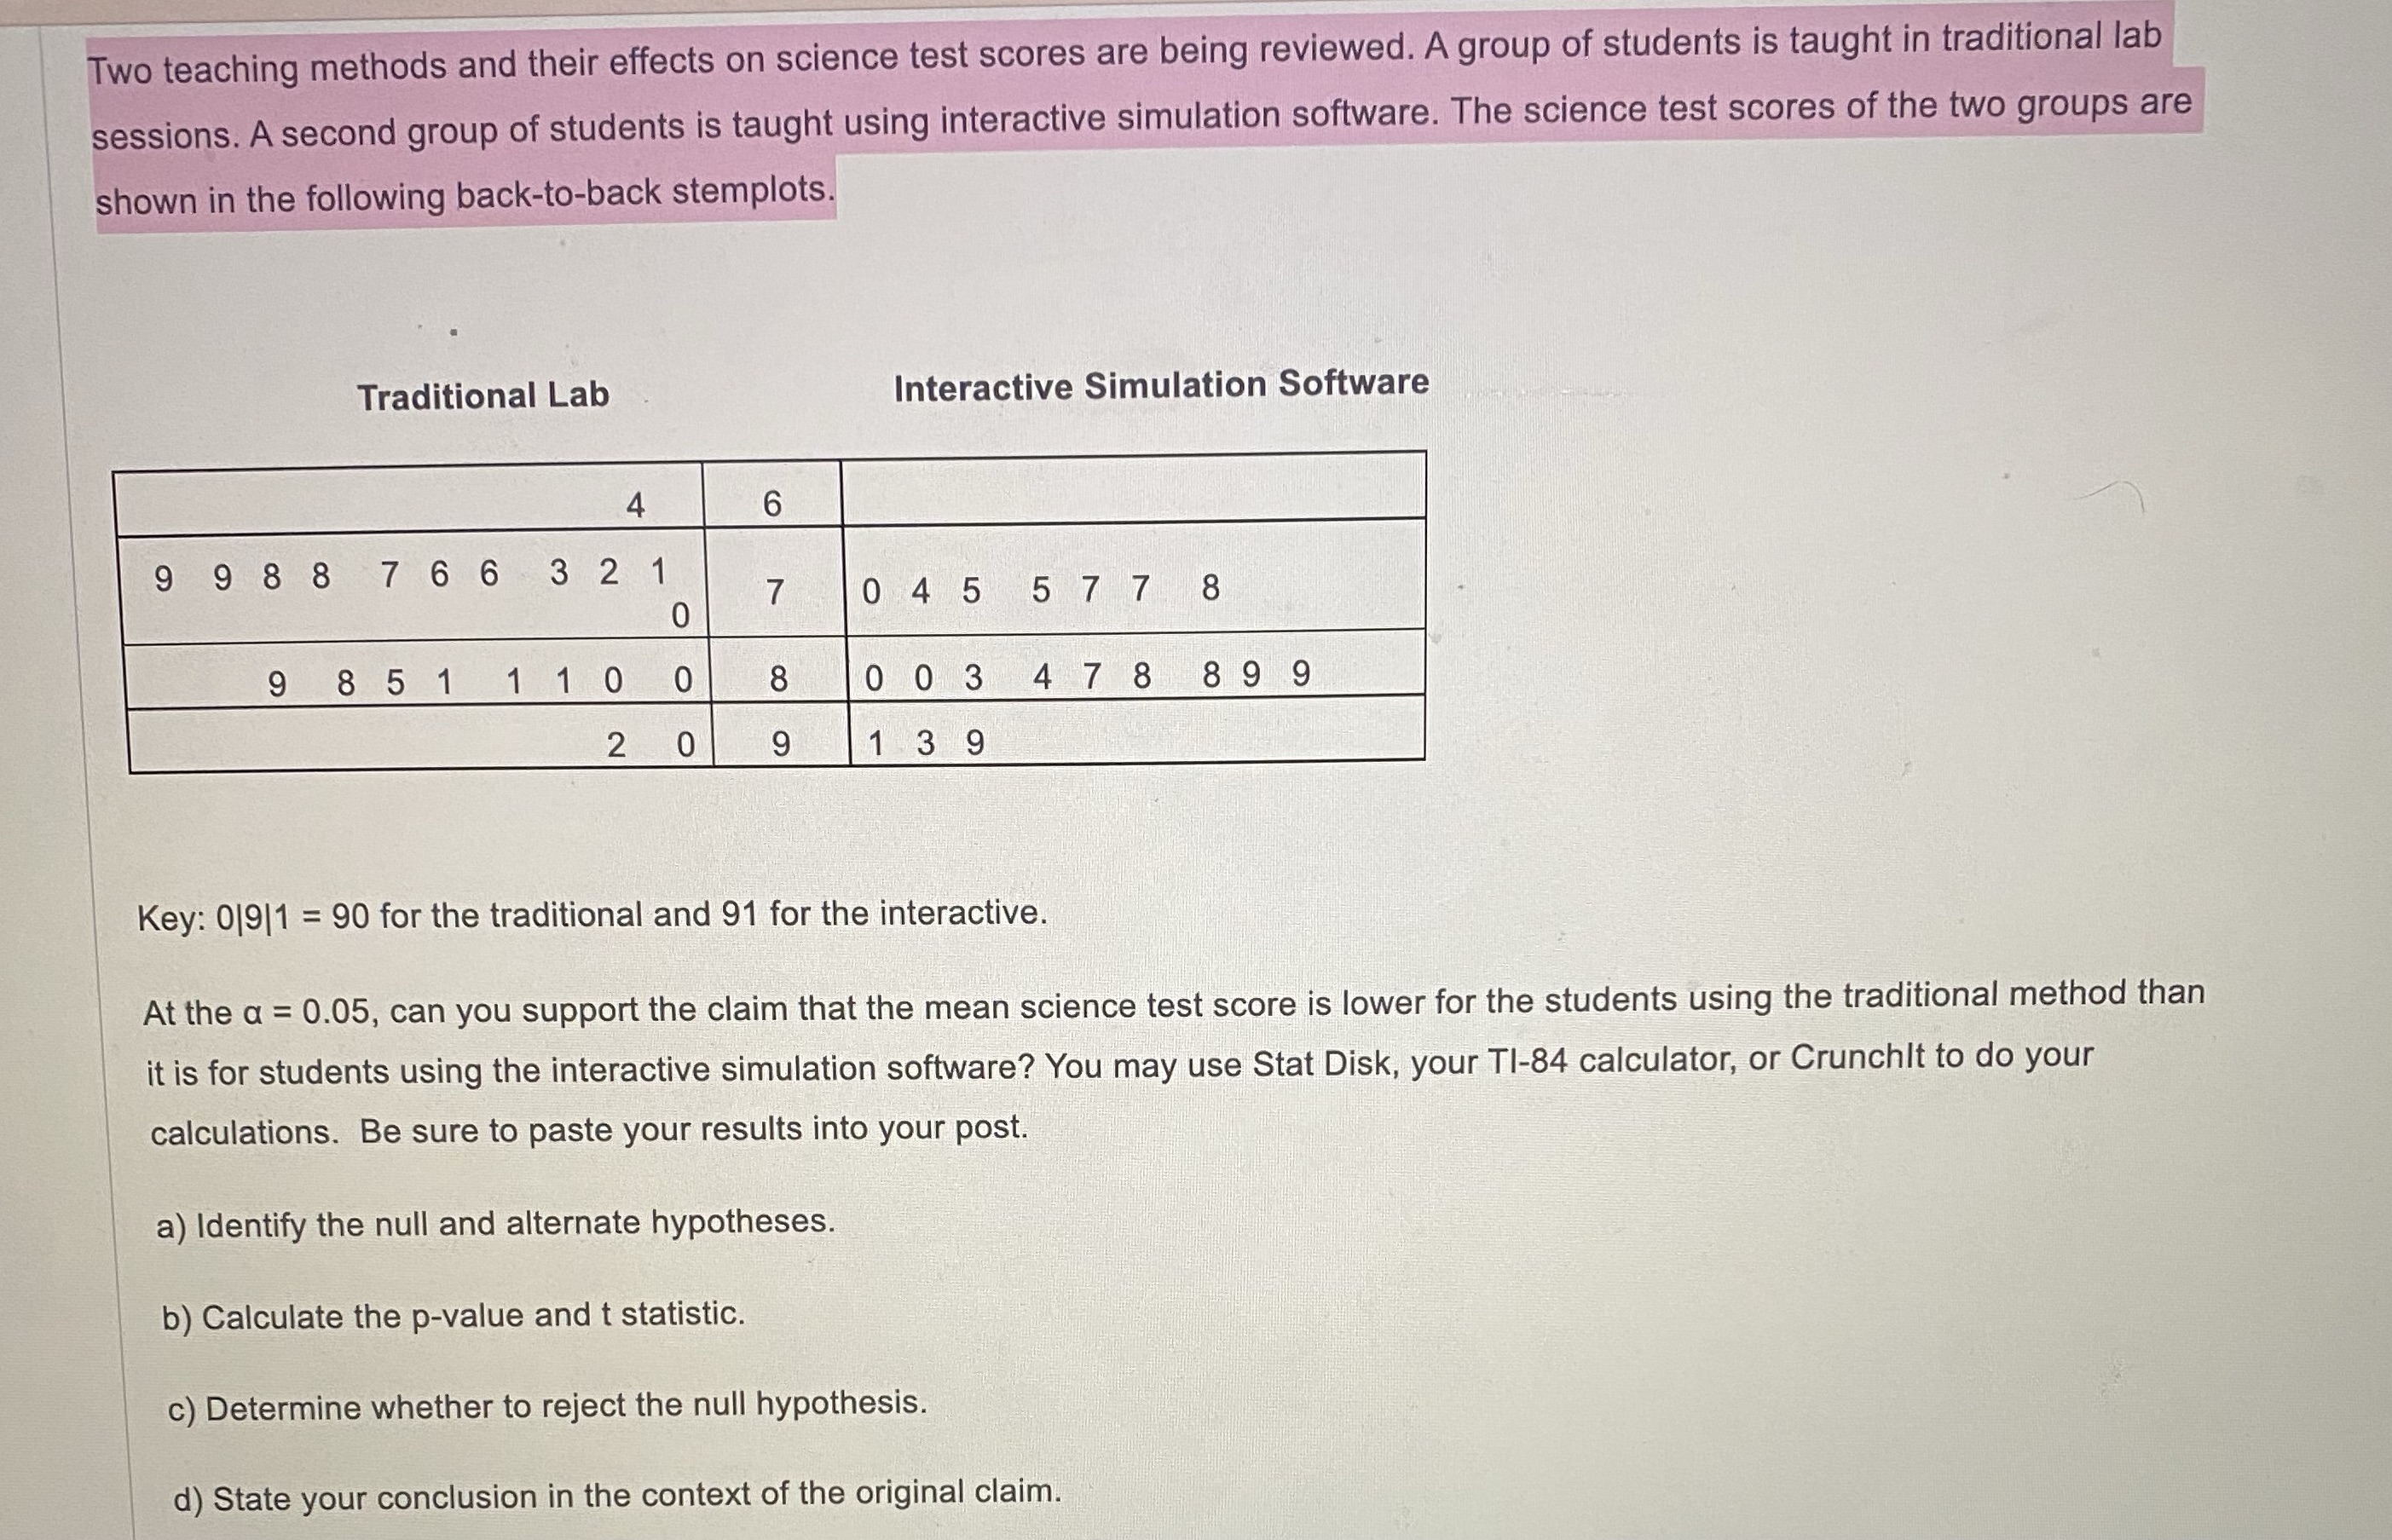
Two teaching methods and their effects on science test scores are being reviewed. A group of students is taught in traditional lab sessions. A second group of students is taught using interactive simulation software. The science test scores of the two groups are shown in the following back-to-back stemplots. Traditional Lab Interactive Simulation Software 4 6 9 9 8 8 7 6 6 3 2 1 7 0 4 5 5 7 7 8 0 9 851 1 10 0 8 0 0 3 4 7 8 89 9 2 0 9 1 3 9 Key: 0|9|1 = 90 for the traditional and 91 for the interactive. At the a = 0.05, can you support the claim that the mean science test score is lower for the students using the traditional method than it is for students using the interactive simulation software? You may use Stat Disk, your TI-84 calculator, or Crunchit to do your calculations. Be sure to paste your results into your post. a) Identify the null and alternate hypotheses. b) Calculate the p-value and t statistic. c) Determine whether to reject the null hypothesis. d) State your conclusion in the context of the original claim
Step by Step Solution
There are 3 Steps involved in it

Get step-by-step solutions from verified subject matter experts